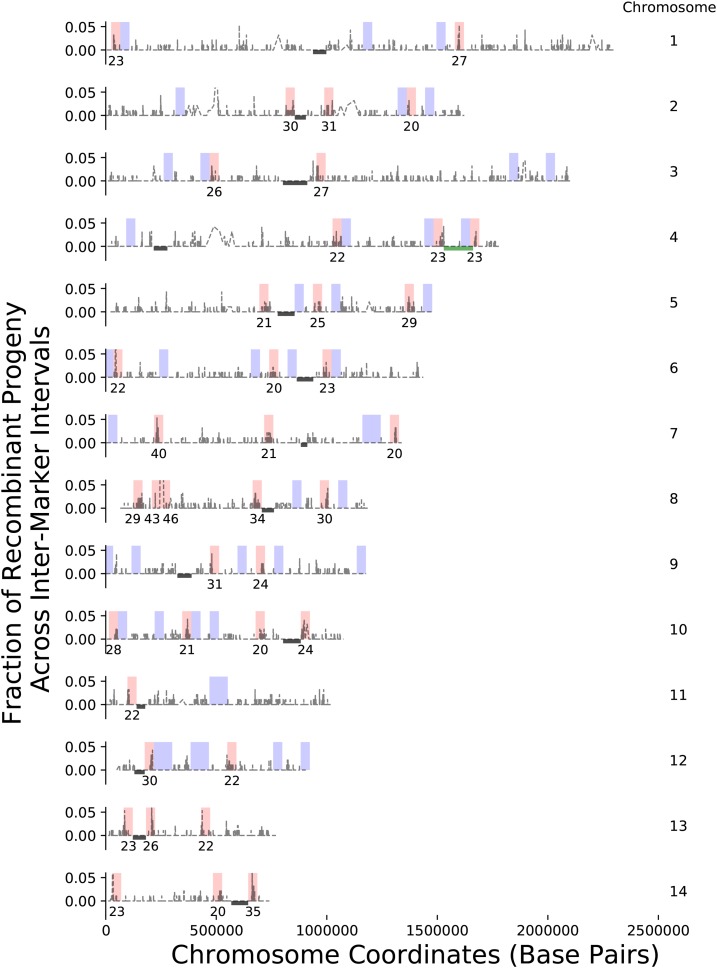
Figure 3.
Genome-wide crossover hot and cold spots. In gray, the fraction of recombinant progeny between intermarker intervals (y-axis) for segregants from the α–α unisexual and a–α bisexual crosses along each of the 14 chromosomes (indicated by number to the right). Crossovers occur within an intermarker interval and are detected as a change in genotype between consecutive SNPs. Bins, 41.5 kb in size, were used to segment each chromosome. For bins identified as crossover hot spots (red), the number of crossovers detected is labeled underneath. All crossover cold spots (blue) have zero detected crossovers. Locations of centromeres and the MAT locus are displayed as black bars and a green bar, respectively. Note that the y-axis has been truncated in many instances to visualize crossovers along each chromosome.

