
Figure 1.
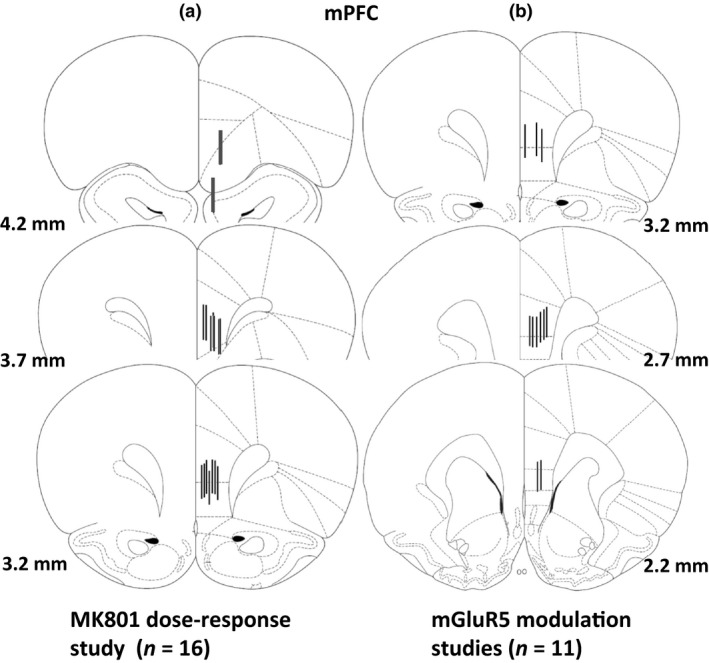
Schematic diagrams of coronal rat brain sections depicting reconstructed biosensor placements within the mPFC. Black lines represent the glutamate‐sensitive region of each sensor. Coordinates are mm forward of bregma. (a) Sensor placements for MK801 dose‐response experiment (n = 14 rats; two rats were excluded because of probe placements outside of the mPFC (shown in red). (b) Sensor placements for mGluR5 modulation experiments (n = 11 rats). Drawings adapted from Paxinos, George; Watson, Charles. (1998). The Rat Brain in Stereotaxic Coordinates. London: Academic Press.