Fig. 3.
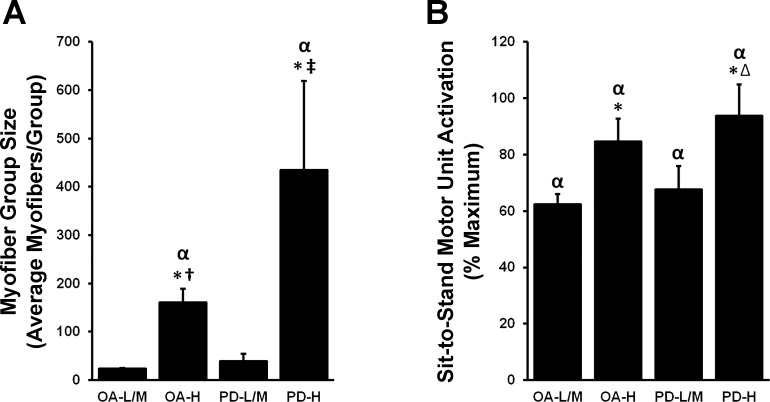
Type I myofiber group size and sit-to-stand motor unit activation (MUA) increase with increasing type I myofiber grouping prevalence. K-means clusters of older adults (OA) and PD individuals displaying low-to-moderate (OA-L/M, PD-L/M) and high (OA-H, PD-H) type I myofiber grouping prevalence were used to assess a relationship between myofiber grouping prevalence and myofiber groups size/MUA. A: those individuals with the most type I myofiber grouping (OA-H, PD-H) displayed the largest myofiber group sizes. B: although OA-L/M and PD-L/M all display heightened MUA compared with YA, OA-H and PD-H display abnormally high MUA. Therefore, overall age and disease effects in OA and PD for group size and MUA appear to have been driven by OA-H and PD-H, respectively. αDifferent from YA, P < 0.05; *different from L/M cluster within groups, P < 0.05; †different from PD-L/M, P < 0.05; ∆different from OA-L/M, P < 0.05; ‡different from OA-L/M/H, P < 0.05. Values are means + SE.

