Fig. 5.
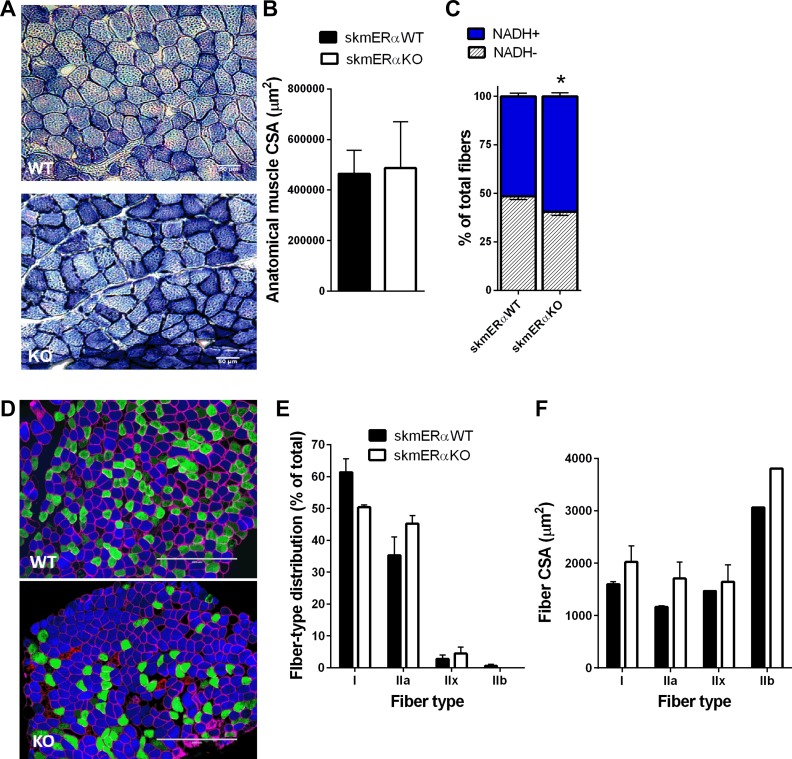
Factors that could influence fatigability of soleus muscle. A: representative images of NADH-TR staining of soleus muscle cross sections from female skmERαWT and skmERαKO mice. Dark blue, NADH+ fibers; light blue, NADH− fibers. B: anatomical muscle cross-sectional area (CSA) did not differ between skmERαWT (n = 5) and skmERαKO (n = 4) mice (P > 0.834). C: % of NADH+ fibers was greater in skmERαKO than skmERαWT mice (P = 0.015) D: representative images of skeletal muscle fiber typing in cross sections of soleus muscles from skmERαWT and skmERαKO mice. Myosin heavy chain isoform staining is as follows: type I (blue), type IIa (green), type IIb (red), and type IIx (unstained) fibers. Muscle fiber border depicted by dystrophin (pink). E: fiber type distribution in soleus muscles from skmERαWT (n = 5) and skmERαKO (n = 4) mice did not differ (P > 0.055). F: CSA by fiber type in skmERαWT and skmERαKO soleus muscles did not differ (P > 0.132). *Significantly different from skmERαWT.

