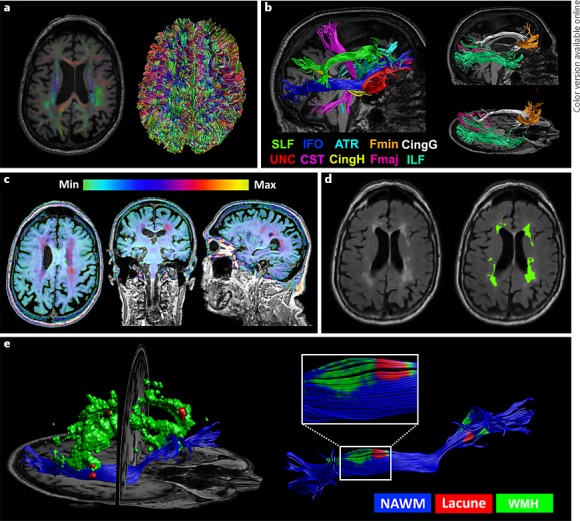
Fig. 1.

Illustration of the image processing procedure and integration of microstructural and macrostructural data for a single patient. a Left: color-coded fractional anisotropy (FA) map overlaying the corresponding T1 image after correcting for susceptibility-induced deformations. Right: results of whole brain tractography, which is used to extract the FA and mean diffusivity (MD) of the whole brain white matter. b Tractography results of 10 white matter fiber bundles (8 of which were bilaterally reconstructed), used to extract the FA and MD of each tract. c T2 FLAIR image projected onto the corresponding T1 image after rigid registration. The color bar applies to the intensity range of the T2 FLAIR image. d Sagittal T2 FLAIR slice before and after manual segmentation. White matter hyperintensities (WMHs) are green and lacunes are red. e Left: 3D reconstruction of WMHs and lacunes in relation to the right inferior fronto-occipital fasciculus. Right: integration of WMHs and lacunes with the inferior fronto-occipital fasciculus is used to extract the FA and MD of the normal-appearing white matter and the proportion of the tract that is affected by these lesions.
