
Figure 3.
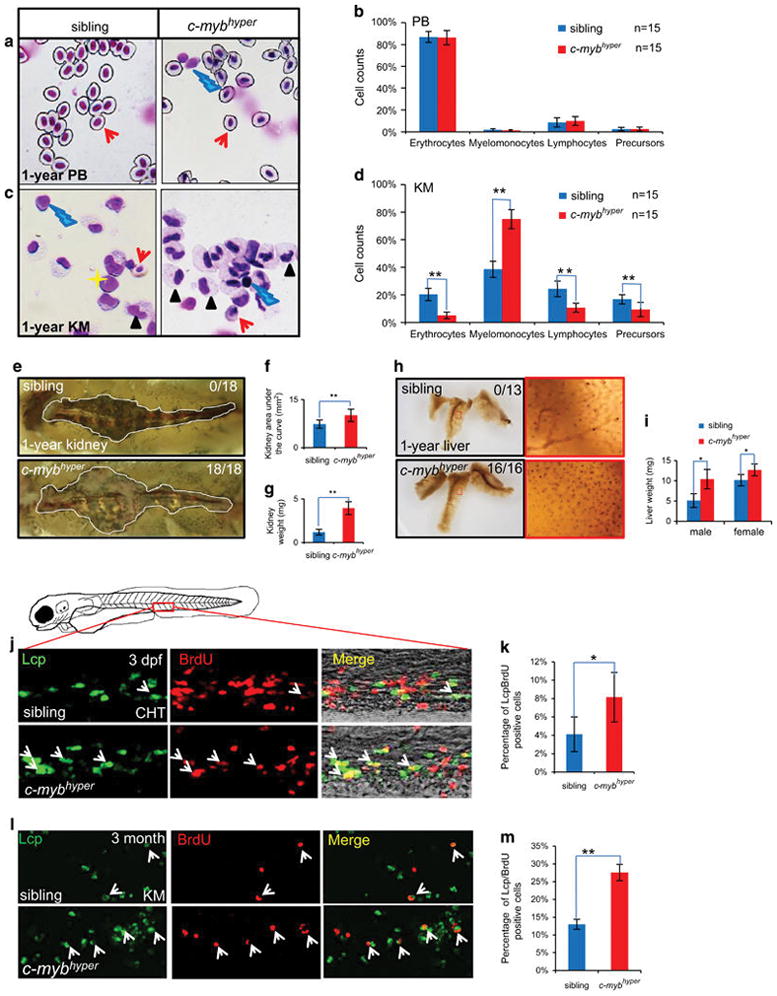
c-mybhyper adult fish exhibit MDS-like phenotypes with abnormal myeloid cell expansion in the kidney. (a–d) Peripheral blood (PB) cells (a) and whole kidney marrow (KM) blood cells (c) in 1-year-old c-mybhyper and sibling fish stained with May-Grunwald/Giemsa. Blood cell counts of PB (b) and KM (d) in siblings (blue bars) and c-mybhyper fish (red bars) were calculated manually based on their morphology. The black asterisks indicate statistical difference (t-test) (n = 15; mean ±s.d.; *P<0.05, **P<0.01). Red arrows, yellow asterisks, black arrowheads and blue lightnings indicate erythrocytes, precursors, myelomonocytes and lymphocytes, respectively. (e–i) Nephromegaly and hepatomegaly occurred in c-mybhyper fish. Kidneys from 1-year transgenic fish were enlarged (e) to 1.4-fold in area (f) and 3.3-fold in weight (g) compared with siblings. (h) SB staining in livers from 1-year transgenic fish showed more SB+ cells than that of siblings. The right red columns show enlarged details of the left red-boxed region. (i) Liver weights in c-mybhyper fish were increased compared with siblings (t-test, sibling and c-mybhyper, n =10 and n =12, respectively; mean ±s.d.; *P<0.05, **P<0.01). Numbers in each panel indicate the number of liver with elevated SB-positive cells out of total number of liver (Fisher’s exact tests, P<0.01) (j–m) Aberrant c-myb activity caused increased proliferation of myeloid cells in embryos (j, k) and KM of adults (l, m). Double staining of bromodeoxyuridine (BrdU)/Lcp (j, l) show BrdU incorporation of caudal hematopoietic tissue (CHT)/KM Lcp+ cells in 3 dpf/3-month c-mybhyper and siblings. Arrows indicate Lcp/BrdU double-positive cells. Percentage of the CHT and KM localized Lcp+ myeloid cells that incorporate BrdU (k, m) in Lcp+ myeloid cells (t-test, sibling and c-mybhyper, n =15 and n =13, respectively; mean ±s.d.; *P<0.05, **P<0.01).