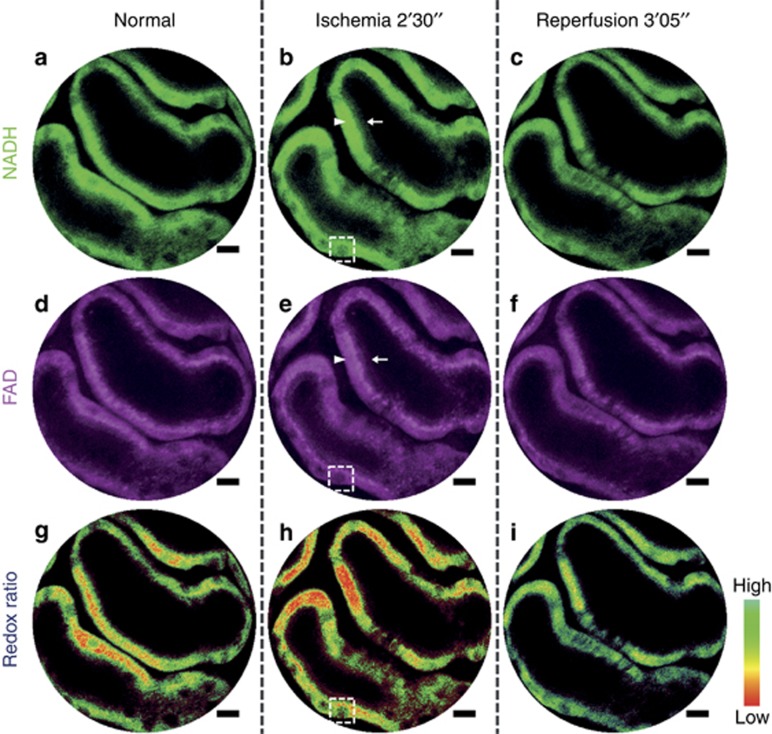
Figure 4.
Endomicroscopy 2PF redox imaging of a mouse kidney ischemia–reperfusion model in vivo. Top row (a–c): 2PF intensity images from the NADH detection channel (417–477 nm); middle row (d–f): 2PF intensity images from the FAD detection channel (496–665 nm); bottom row (g–i): 2PF intensity images color-coded by the measured optical redox ratio defined as FAD/(FAD+NADH), where more reddish (greenish) color corresponds to an increased (reduced) concentration of NADH and thus a reduced (increased) redox ratio. The dark round-to-elliptical spots scattered along the renal tubule wall (dashed squares) correspond to the nuclei of renal tubular cells. Each column corresponds to one specific time point: normal (left), 2 min 30 s post ischemia (center) and 3 min 05 s post reperfusion (right). All images shown are averaged over five raw frames acquired using the 200-μm WD miniature objective with an incident power of ~33 mW at 750 nm, corresponding to an effective frame acquisition time of ~1.9 s. Scale bar=10 μm.

