
Figure 4. Distinct gene signature defines reactivated latent cells.
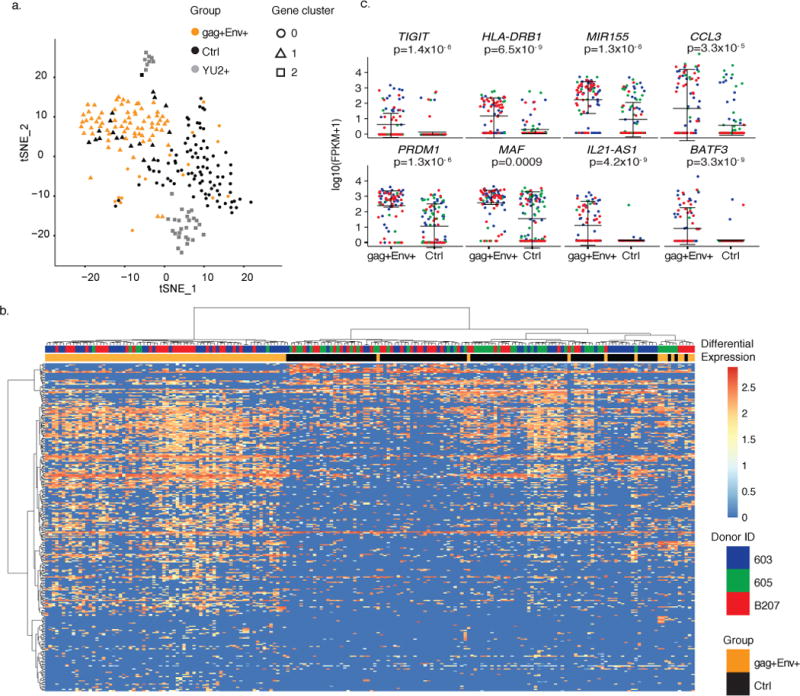
a) Principal components analysis (PCA) clusters cells by group. Shown is the Seurat t-SNE displayed output for the three groups. Plot shows single cells (Control (black), Env+ LURE (orange) and YU2 (gray)). Seurat analysis identified 3 distinct clusters of genes which define three groups of cells (circles (gene cluster 0), triangles (gene cluster 1) and squares (gene cluster 2)) by performing graph-based clustering over 6 principal components. Shown is all data obtained from individuals 603, 605, and B207 (control and LURE cells) and HIV-1YU2 infected healthy donor cells (109 control cells, 85 LURE cells and 33 HIV-1YU2 infected cells). b) Heat-map shows unsupervised clustering of differentially expressed genes between the gag+Env+ LURE purified group (orange bars) and control unfractionated group (black bars). Cells from donor 603 are indicated in blue, 605 in green, and B207 in red. Color indicates the normalized level of expression. c) Graphs show expression of selected significantly differentially expressed genes in individual gag+Env+ LURE purified and control unfractionated cells as determined by MAST software in participants 603 (blue), 605 (green), B207(red). Shown is all data obtained from individuals 603, 605, and B207 (109 control cells and 85 LURE cells). Error bars show mean and standard deviation. Significant differential expression was determined using the likelihood ratio test embedded in the MAST software.