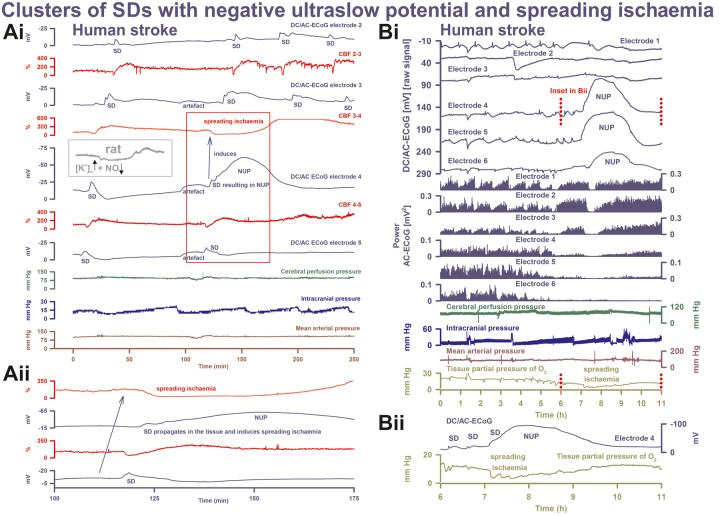
Figure 6.
SD inducing NUP and spreading ischaemia. (Ai) The NUP of Patient 6, a 44-year-old previously healthy female, was recorded on Day 9 (onset: 218 h 4 min) after the initial haemorrhage. The second SD at electrode 4 not only resulted in a NUP but also induced the characteristic drop in CBF typical of spreading ischaemia in rat experiments when the NO availability is low and the extracellular baseline potassium concentration ([K+]o) is elevated (Dreier et al., 1998; Dreier, 2011) (cf. grey inset). This rodent model mimicking the conditions present following aSAH is also typically characterized by a marked hyperaemia succeeding the spreading ischaemia in contrast to the rat model of proximal arterial occlusion in which spreading ischaemia typically occurs with no or only a minor succeeding hyperaemia (cf. Figure 3 in Feuerstein et al., 2014). A marked, long-lasting hyperaemia succeeding the spreading ischaemia of 50-min duration is seen at optode 3–4 in this patient corresponding with the model mimicking aSAH. The duration of the NUP correlates well with the duration of the spreading ischaemia, as in previous animal experiments (Dreier et al., 2002; Sukhotinsky et al., 2008), because the decreases in perfusion and energy supply limit Na,K-ATPase activity and prolong depolarization (Dreier et al., 1998; Dreier, 2011; Major et al., 2017). Animal experiments suggested that, if sufficiently prolonged, spreading ischaemia causes cell death (Dreier et al., 2000). Accordingly, the patient developed a new infarct at electrodes 4–6 between Days 8 and 12 (Supplementary Fig. 2). After the spreading ischaemia shown in the figure, subsequent ones also involved (opto-) electrodes 4 to 6. The patient died due to the progressive brain infarctions on Day 13. (Aii) CBF and DC/AC-ECoG data from Ai on an expanded time scale to visualize the propagation of the SD and the SD-induced spreading ischaemia (blue arrow). Note that the durations of the negative DC shifts correlate well with the durations of the SD-induced hypoperfusions at the two different recording sites. (B) The NUP of Patient 2, a 50-year-old previously healthy female, was recorded on Day 1 (onset: 39 h 37 min) after the initial haemorrhage. It developed out of a long cluster of recurrent SDs. Note that the SD-induced drops in ptiO2 became progressively more pronounced during the cluster until the SD-initiating NUP finally induced a long-lasting hypoxia/ischaemia. The MRI on Day 2 showed early band-like infarcts of the cortex and underlying white matter in the left middle cerebral artery territory where the electrode strip was located (involving electrodes 4–6) and band-like infarcts in the medial frontal area bilaterally (Supplementary Fig. 3). The second MRI scan on Day 7 revealed new infarcts in the left middle cerebral artery and posterior cerebral artery territories, as well as growth of the previously established infarcts in the right middle cerebral artery and both anterior cerebral artery territories. On Day 9, the patient presented with dilated, fixed pupils. A CT scan showed progressive brain oedema. The patient died on Day 11. (Bii) Panel shows the same ptiO2 and DC/AC-ECoG data from Bi on an expanded time scale to visualize the correlation between the durations of the negative DC shift and the SD-induced hypoxia/ischaemia, similar to the illustration in Aii.

