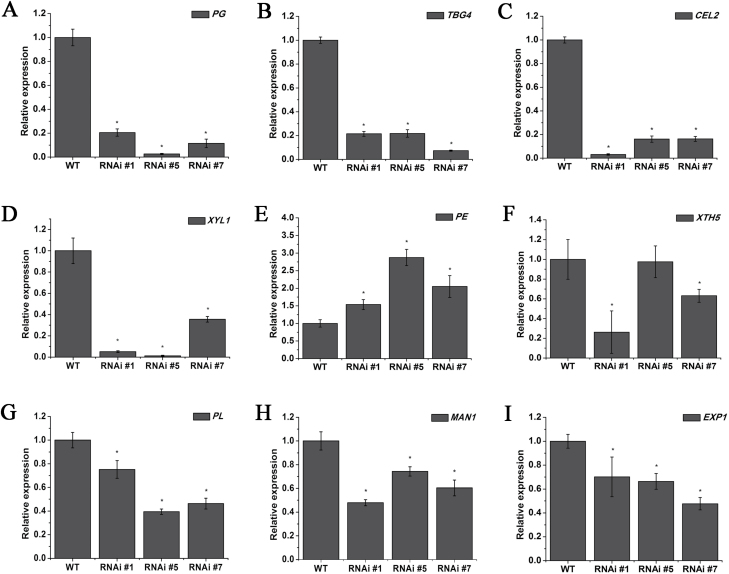
Fig. 4.
(A–I) Relative expression profiles of cell wall metabolism genes in the pericarp of WT and SlFSR-RNAi tomato fruits. The expression data for WT plants were normalized to a value of 1. Each value represents the mean ±SE of three replicates. Asterisks indicate significant differences (P<0.05) between WT and RNAi lines.

