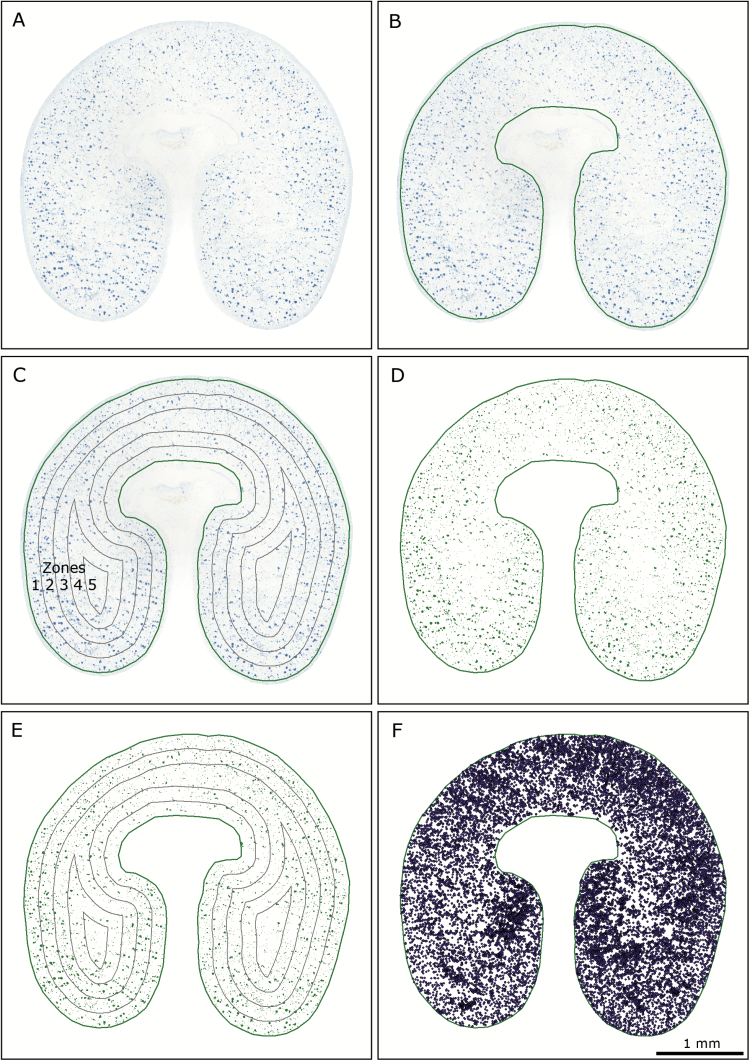
Fig. 1.
Overview of the grain protein gradient analysis procedure. (A) A composite light-microscopy image of a 1-µm thick wheat grain section selectively stained for protein with 1% Naphthol Blue Black in 7% acetic acid (v/v) is loaded. (B) An outline is manually drawn around the endosperm, just inside the aleurone layer. (C) Five concentric bands are automatically drawn inwards from the outline of the endosperm, creating zones representing tissue from outer to inner endosperm (labelled 1–5). (D) Pixels representing protein are extracted using image classification, and the background is removed. (E) The zones from stage (C) are overlaid on the extracted protein from stage (D) and protein concentration values are calculated on an area basis for each zone within the endosperm. (F) For protein body size distribution analysis, individual protein bodies are detected, and their area and distance from the aleurone layer are measured. The example shown is a section from a grain under the high-nitrogen, 20 /15 °C temperature treatment, sampled at 21 d post-anthesis.

