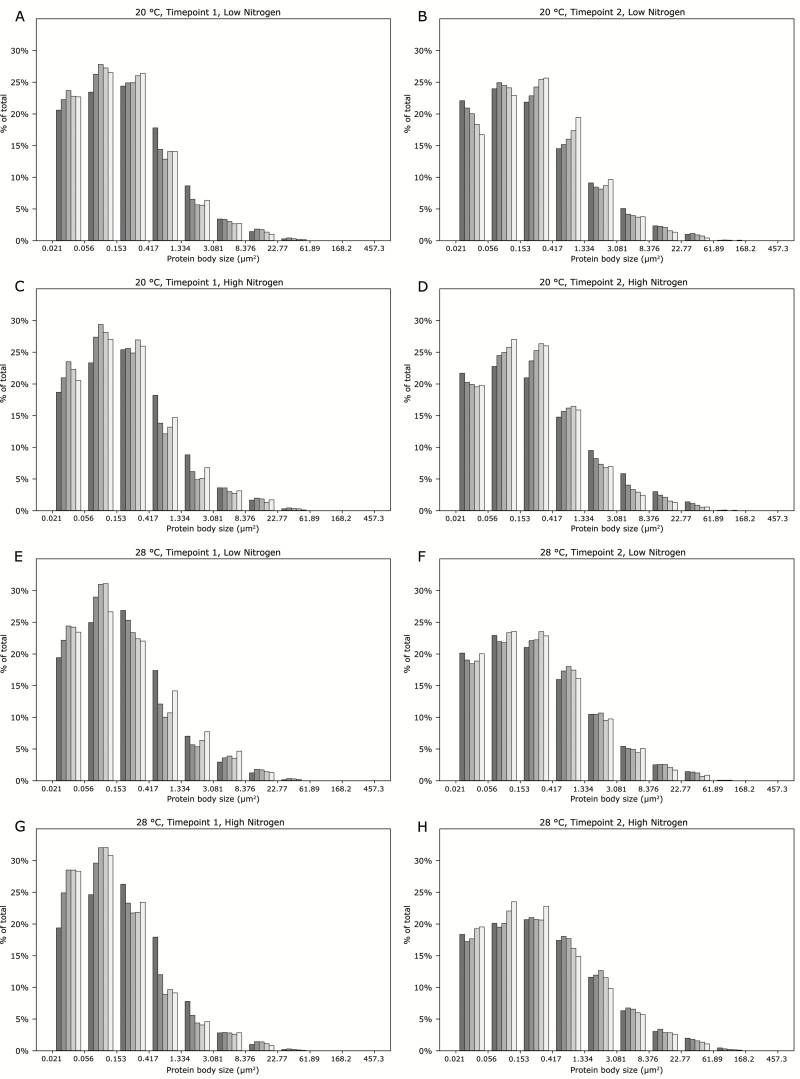
Fig. 5.
Histograms showing the frequency of protein body sizes across each of the five endosperm zones. Grain was (A) grown at 20 °C with low-nitrogen treatment and sampled at timepoint 1, and (B) sampled at timepoint 2; (C) grown at 20 °C with high-nitrogen treatment and sampled at timepoint 1, and (D) sampled at timepoint 2; (E) grown at 28 °C with low-nitrogen treatment and sampled at timepoint 1, and (F) sampled at timepoint 2; (G) grown at 28 °C with high-nitrogen and sampled at timepoint 1, and (H) sampled at timepoint 2. Data for zones 1–5 (see Fig. 1) are represented within each graph by shades of grey from dark (zone 1) to light (zone 5), and are the same zones that were used to plot the means in Fig. 4.

