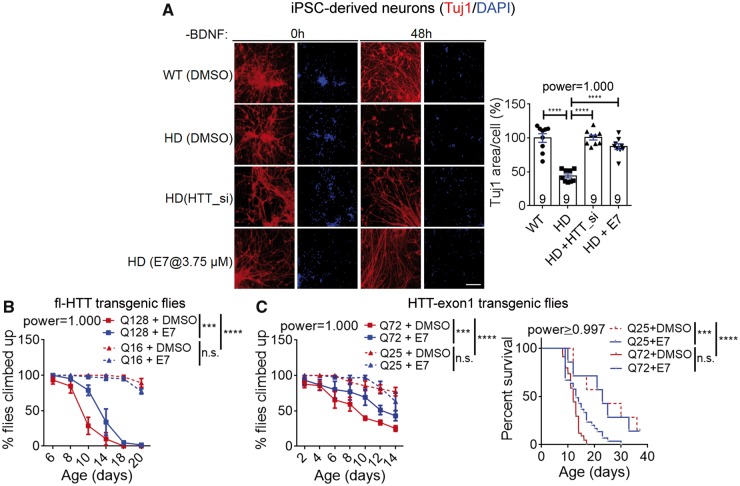
Figure 7.
A novel Gpr52 antagonist E7 rescued Huntington’s disease-associated phenotypes in cells and flies. (A) Images: representative immunostaining results of neuronal specific tubulin marker Tuj1and DAPI showing neuronal morphology of patient iPSC-derived striatal neurons (Huntington’s disease: Q47; wild-type: Q19). Loss of processes and shrinkage of neurons could be observed in Huntington’s disease neuronal after BDNF removal. Scale bar = 100 μm. Bar plots: quantification of the Tuj1 signal covered area (Tuj1 area) normalized to the nuclei counts. The lower Tuj1 area per cell reflects neuronal processes shrinkage and loss. Data were normalized to the wild-type control. The statistical analysis was performed by one-way ANOVA with post hoc Dunnett’s tests: ****P < 0.0001. (B) Virgin female flies with indicated genotypes and treatment were placed in different vials and tested in the climbing behavioural assay. Q128: full-length HTT-Q128 driven by elav-GAL4, n = 4 for both DMSO and E7 (10 μM) treated groups; Q16: full-length HTT-Q16 driven by elav-GAL4, n = 3 for both DMSO and E7 (10 μM) treated groups. n indicates the number of different batches of flies, which were place in different vials at 15 flies (virgin female) per vial. Data were plotted as mean ± SEM, and the statistical analysis was performed by two-way ANOVA tests. ***P < 0.001, ****P < 0.0001. (C) Left: As in B, but using flies expressing HTT-exon1 fragments with indicated Q lengths. The statistical analysis was performed by two-way ANOVA tests. ***P < 0.001, ****P < 0.0001. Right: survival curves of the flies expressing HTT-exon1 fragments treated with the indicated compounds. The statistical analysis was performed by the log-rank test. ***P < 0.001, ****P < 0.0001.

