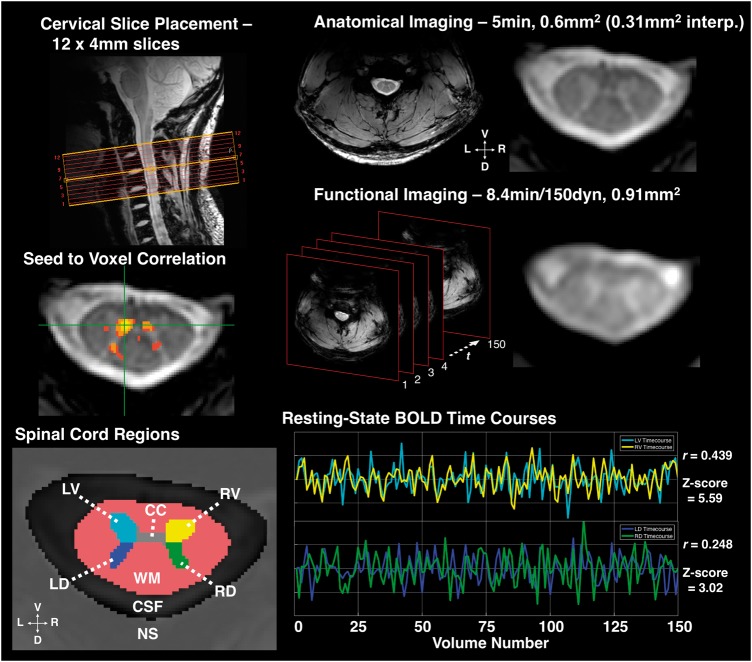
Figure 1.
Imaging and resting state connectivity. Top left: Example slice placement as centred over C3-C4 vertebral disk, used as landmark for placement in all subjects. Top right: Example high resolution, T2*-weighted anatomical image and close-up; interp. = interpolated voxel size (displayed in figure). Middle right: Example functional MRI-weighted acquisition and schematic of functional imaging showing 150 volumes acquired over time (t), which was every 3.34 s. Functional images acquired using a 3D multishot gradient echo sequence, images shown after registration and interpolation to anatomical space. Middle left: Example seed-to-voxel correlation map (thresholded at Pearson’s r > 0.465, P < 10−7 uncorrected). An example seed voxel in left ventral grey matter (GM) shows correlation with contralateral ventral, ipsilateral dorsal, and contralateral dorsal grey matter. Bottom left: Spinal cord regions of interest defined during manual segmentation and preprocessing. CC = central commissure of grey matter (voxels excluded from analyses); LD = left dorsal grey matter horn; LV = left ventral grey matter horn; RD = right dorsal grey matter horn; RV = right ventral grey matter horn; NS = ‘not-spine’ mask (included all voxels outside of the spinal canal); WM = white matter. Bottom right: Representative functional MRI BOLD signal timecourses in a single slice from LV and RV, and LD and RD, respectively, after bandpass filter. Pearson’s r and associated Z-score for correlation between both region of interest pairs provided.

