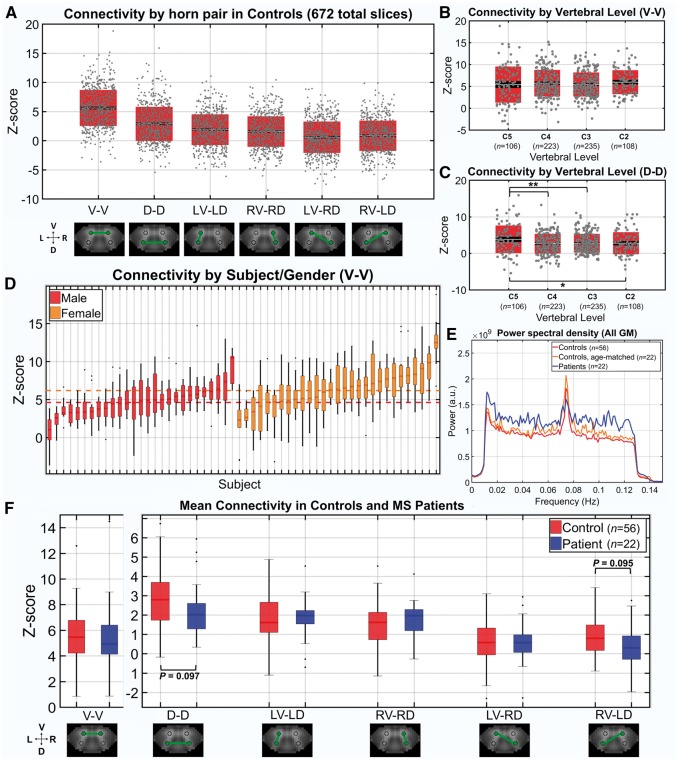
Figure 2.
Functional connectivity in controls and multiple sclerosis patients. (A) Box/dot plots of z-scores (i.e. connectivity strength) from every slice in controls (56 subjects × 12 slices = 672 total) for each region of interest pairing. Z-score = tanh−1(r) (dof − 3)1/2, where r is the Pearson correlation coefficient between mean timeseries from each region of interest and dof is the estimated degrees of freedom after correction for first-order autocorrelation. The mean z-score across all slices is indicated by a white midline, with black indicating the standard error of the mean and boxes indicating the standard deviation. (B and C) Box/dot plots showing z-scores for V-V and D-D across vertebral levels. Boxplots indicators are the same as in A. Two-tailed Wilcoxon rank-sum tests were performed, *P < 0.05, **P < 0.01. (D) Boxplots of z-scores for V-V in each of the 56 control subjects (12 slices/z-scores per subject), grouped by gender and ordered according to median z-score (lowest to highest within the group). The median z-score for each subject is indicated by a dark midline and boxes indicate the 25–75% quartile ranges. Whiskers extend to the most extreme z-scores not considered outliers and outliers are indicated with a black dot. Red and orange dotted lines indicate the median z-score across all males and females, respectively. (E) Group average power, after bandpass filtering. Each subject’s mean power estimated across all grey matter voxels. Wilcoxon rank-sum tests detected no significant differences between groups after division of the spectrum into 10 frequency bins. (F) Boxplots of mean z-scores for each region of interest pairing in controls (n = 56) and patients (n = 22). Subjects contributed a single mean z-score across 12 slices for each region of interest pair. Boxplots indicators are the same as previously described for D. Two-tailed Wilcoxon rank-sum tests detected no significant differences between control and patients; however, there was a trend towards decreased D-D as well as RV-LD connectivity in patients (P = 0.097 and P = 0.095, respectively).

