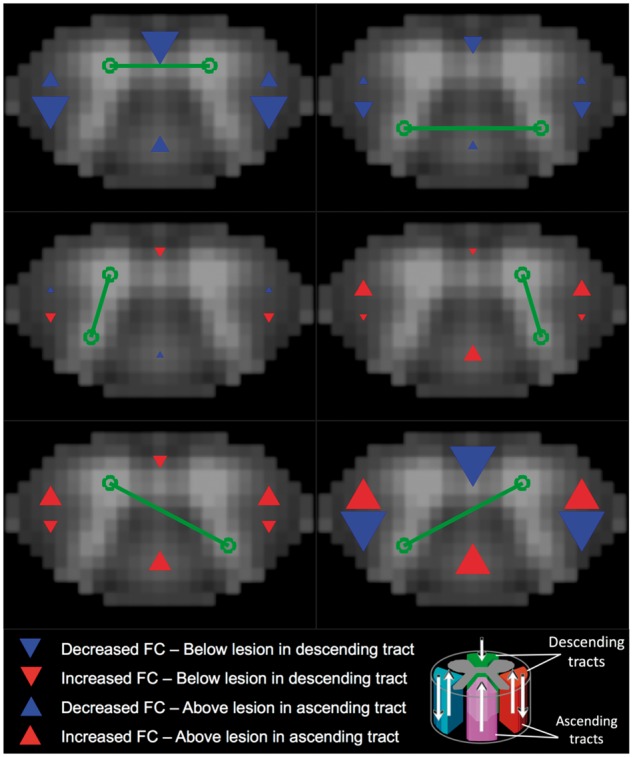
Figure 5.

Distal effects of lesions on functional connectivity. Visual representation of effect sizes for distal presence of lesion in relation to region of interest pair z-score. Effect size estimates came from independent linear mixed-effects models of slicewise region of interest pair connectivity strength (z-scores), and are reported in Table 3. In each model, a random effect of subject was included, along with fixed effects of group, age, gender, and median slicewise temporal signal-to-noise ratio in grey matter. Red and blue arrows indicate positive and negative effect estimates, respectively, are proportional to the magnitude of the effect size, and are located in the regions which they represent. Slices were rated as containing a descending tract lesion if a lesion was present in at least one of the ventral, left lateral, or right lateral tracts; and a descending tract lesion if a lesion was present in at least one of the dorsal, left lateral, or right lateral tracts. Based on this classification, two independent variables were constructed in which slices were assigned a binary value indicating whether they did (1) or did not (0) occur (i) above (superior to) an ascending tract lesion (‘Above’ variable in Table 3, upward facing arrows in figure); and (ii) below (inferior to) a descending tract lesion (‘Below’ variable in Table, downward facing arrows in figure). Slices could receive only binary classifications of 1 or 0 for the Above and Below variables and thus were not additive, for instance in cases where a slice was above multiple ascending tract lesions. All patient (n = 22) and control (n = 56) data were included the models, with each subject contributing 12 slicewise values (thus a total of 936 values for each variable, with repeated measures for subject, group, age, and gender). For all slices, controls received zeros for Above and Below values. Full statistical results are provided in Supplementary Table 3. Note that the Above and Below variables were included in the same model, such that the estimates provided are the independent effect of a slice occurring above an ascending tract lesion after accounting for all other effects, including the slice occurring below a descending tract lesion. Green lines/circles indicate the region of interest pair assessed in the model. Red boxes indicate P-values < 0.05. Lower/Upper = lower and upper bounds of confidence interval.
