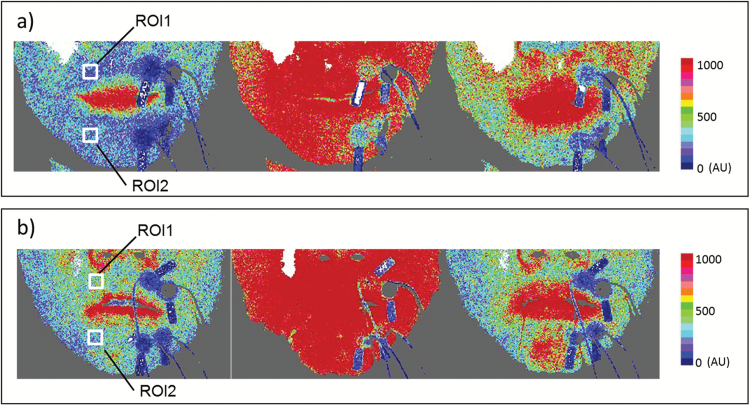
Figure 2.
Images showing BF in defined regions of interest (ROIs). Two ROIs on the perioral muscles were defined in each image. ROIs were set according to the same regions of electrodes as those used for EMG activity measurement. ROI1 denotes the superior orbicularis oris muscle, whereas ROI2 indicates the inferior orbicularis oris muscle. (a) Typical laser speckle perfusion image of a control group subject. (b) Typical laser speckle perfusion image of an experimental group subject. For each image series, the left-hand, middle and right-hand panels represent the rest, exercise and recovery periods, respectively.

