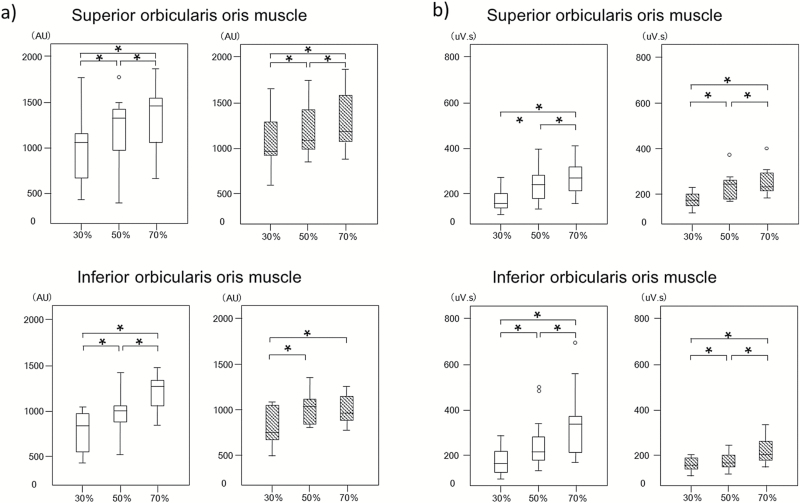
Figure 5.
EMG and BF values at different loading conditions in the control and experimental groups. Box-and-whisker plots show the distribution of BF (a) and EMG activities (b) in the control group (open bars) and experimental group (hatched bars) at different loading conditions. The line in each box represents the median of 30 subjects. The lower and upper boundaries of the box indicate the 25th and 75th percentiles. Error bars represent the 1.5-fold interquartile range. *Denotes a significant difference between the indicated loading conditions (P < 0.05 with the Bonferroni correction).

