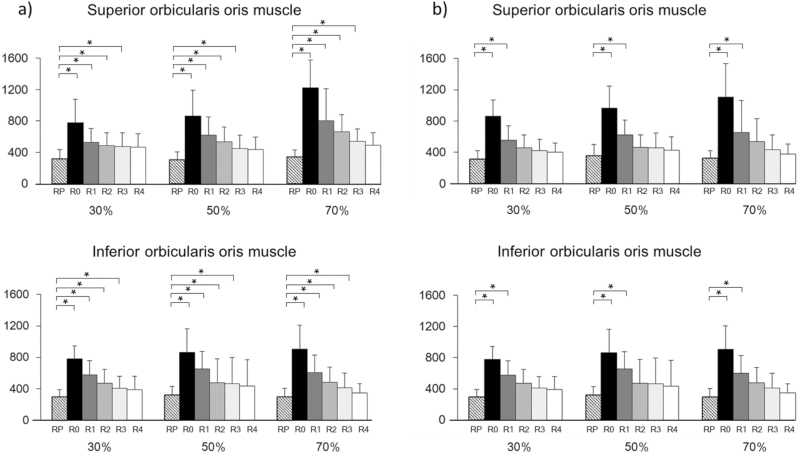
Figure 7.
Changes in BF between the rest and recovery periods. Data are mean ± SD of the change in BF in the superior and inferior orbicularis oris muscle between the rest and recovery periods in (a) the Control group and (b) the Experimental group. RP: rest period; R0, R1, R2, R3, and R4 correspond to the periods at 0–5 s, 6–10 s; 11–15 s, 16–20 s, and 21–25 s after exercise, respectively. *P < 0.05 denotes a significant difference between RP and the groups indicated.

