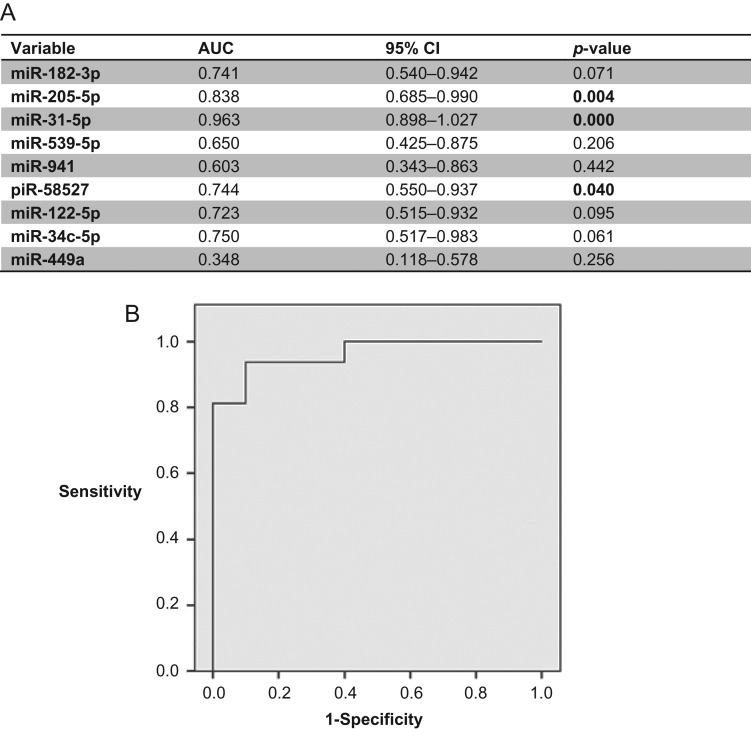
Figure 3.
Predictive efficiency of miRNA variables for distinguishing SA from OA samples. (A) Receiver operating characteristic (ROC) curve analysis showing the predictive efficiency of miRNA variables for distinguishing SA from OA samples at the validation stage. (B) ROC curve of miR-31-5p for predictive classification of azoospermic samples into SA and OA sub-phenotypes at the validation stage.

