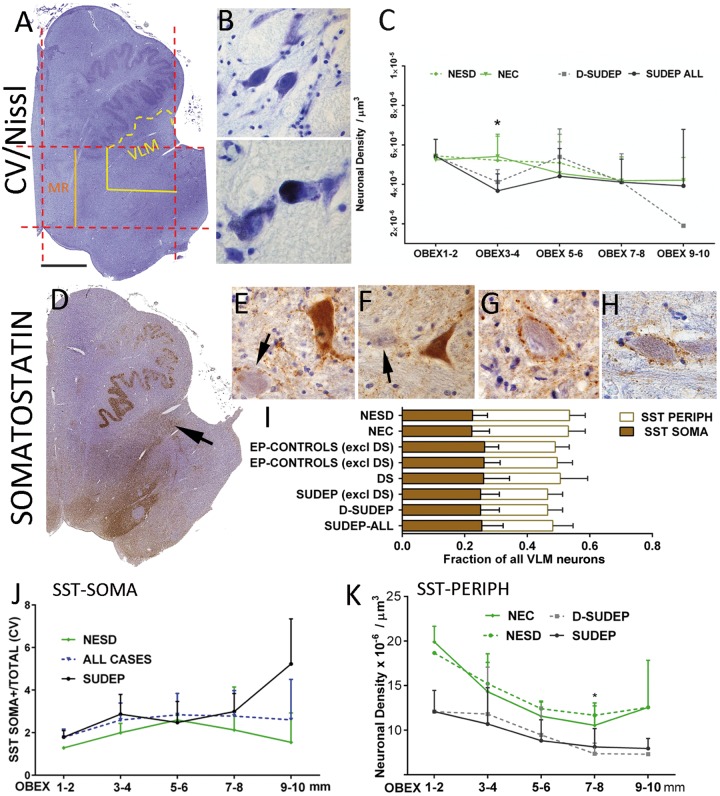
Figure 1.
Stereology analysis of neurons in VLM. (A) Cresyl violet (CV). The regions of interest were delineated using the image analysis systems by drawing a rectangle in one-half of the brainstem (dashed red lines) using anatomical boundaries. The midline was first drawn and a parallel line at the lateral edge of the inferior olive nucleus. Perpendicular lines to these were drawn through the ventral recess of the fourth ventricle and the ventromedial part of the olive. The outer, ventral quadrant of this region (shown in yellow) became VLM, with the ventral aspect extended along the contour of the olive. Care was taken to exclude the olive nucleus from all quantitative analysis. The medial raphe (MR) region of interest was the medial quarter of the main rectangle (shown in orange), abutting the midline. This is shown for a hemi-brainstem, which was used in stereology. For whole slide scanning analysis in whole brainstem sections, identical region of interest were constructed on the opposite side and mean values over the two sides calculated. (B) Cresyl violet-stained neurons in the VLM/reticular formation (top); in the bottom image a neuron distended with lipofuscin is shown. (C) Line graphs of neuronal densities on cresyl violet stain in the VLM plotted as mean values (error bars are standard deviations) in SUDEP and control groups relative to the obex level (x-axis) at 2-mm intervals from 1 to 10 mm. There were significant differences between SUDEP and controls at obex 3–4 mm (asterisk). (D) SST labelling in a hemi-medulla section with a band of staining fanning out from ventricle to lateral reticular regions (arrow); note also labelling in the solitary nuclei. (E and F) Examples of patterns of SST labelling are shown with SST-SOMA+ neurons and diffuse cytoplasmic positivity (arrows indicate unstained neurons); in G and H. SST-PERIPH+ neurons with peripheral synaptic like beads of positivity but negative cytoplasm are shown. (I) Bar graph representing the fraction of total cells in VLM labelled with SST showing SST-SOMA+ and SST-PERIPH+ patterns in eight groups. SST-SOMA+ fractions were not significantly different between groups but significantly lower SST-PERIPH+ cells were noted in SUDEP (Error bars represent standard deviations for the groups; see Table 3 for significant differences in mean neuronal numbers (and standard deviations) between groups. (J) Line graph of variation of SST-SOMA+ neurons with obex level in SUDEP and non-epilepsy sudden death controls expressed as ratio of total neuronal densities (error bars represent standard deviations for the groups); the relative number of labelled cells increased with more rostral obex levels and the black dashed line shows values for all cases which correlated with higher obex levels (P = 0.014). (K) Line graph of variations of SST-PERIPH+ neurons with obex level between non epilepsy controls, non-epilepsy sudden death, SUDEP and definite-SUDEP expressed as neuronal density acquired from stereology data (mean values and error bars are standard deviations). The density of neurons declines for all groups with rostral obex levels but is lower in the epilepsy groups compared to the non-epilepsy controls at all obex levels, with the most significant differences noted between definite SUDEP and non-epilepsy sudden death controls at obex 7–8 mm (*P = 0.05). Magnifications: hemi-brainstem images taken at ×0.58 and photomicrographs with ×40 objective lens. Scale bar in A = 1.5 mm for A and D, and 55 μm in B and E–H. D-SUDEP = definite SUDEP; NEC = non-epilepsy controls; NESD = non-epilepsy sudden death controls.

