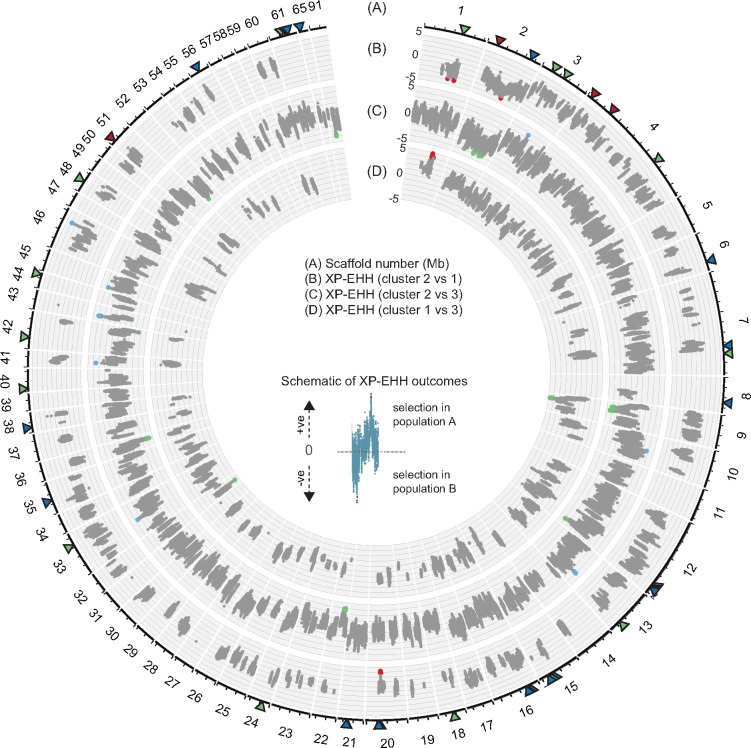
Fig. 3.
—Genome-wide scan of the cross-population extended haplotype homozygosity (XP-EHH) analyses. (A) Scaffolds of the reference genome and positions in Mb. XP-EHH analyses of (B) cluster 2 versus cluster 1, (C) cluster 2 versus cluster 3, (D) cluster 1 versus cluster 3. The positive and negative values in (B)–(D) indicate the direction of selection. Positive values indicate positive selection in the reference population (cluster 2 was used as the reference population in (B) and (C), cluster 1 in (D)). The most significant SNPs (top 0.05% of |XP-EHH|) are highlighted in red, blue, and green for signals of positive selection in cluster 1, 2, and 3, respectively. Triangles near the outermost plot show the most significant SNPs identified by the standardized integrated haplotype |iHS| analyses (red for cluster 1, blue for cluster 2 and green for cluster 3).

