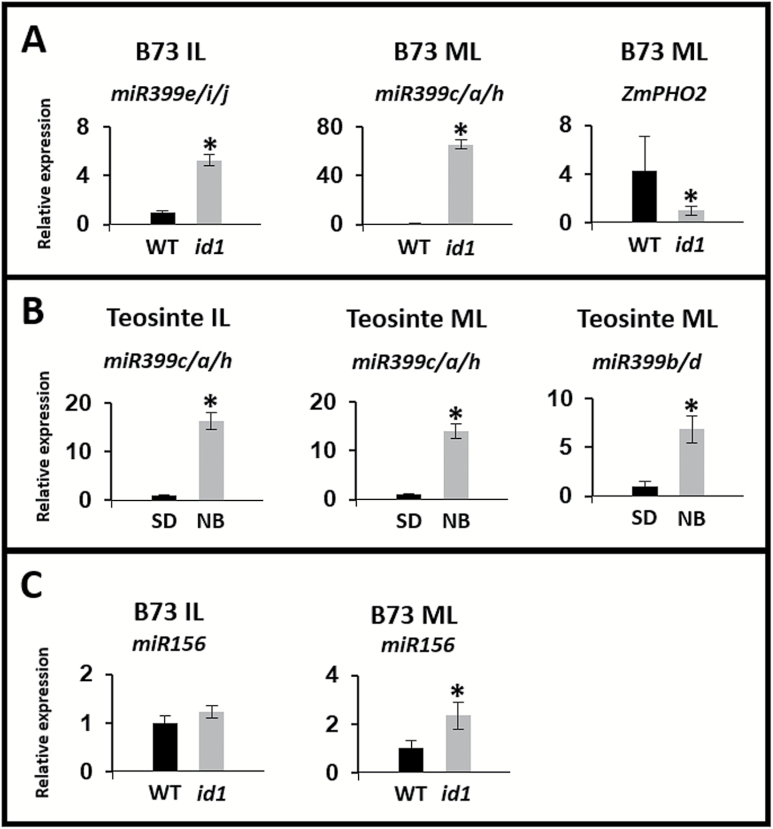
Fig. 4.
qPCR confirmation of miRNA and miRNA target gene expression changes upon floral induction. (A) Stem–loop qPCR quantification of miR399 isoforms and its target ZmPHO2 from immature (IL) and mature (ML) leaves of maize B73 WT and id1 plants. (B) Stem–loop qPCR quantification of miR399 isoforms in teosinte plants grown under inductive short days (SD) and inhibitory night breaks (NB). (C) Stem–loop qPCR quantification of miR156 expression in ILs and MLs from B73 WT and id1 plants. The primers used are not specific for a unique miRNA isoform, and a group of isoforms detected is reported. These graphs are representative of data obtained for one of the three biological replicates analysed. An asterisk indicates a statistically significant change (P≤0.05) when it was achieved across biological replicates.

