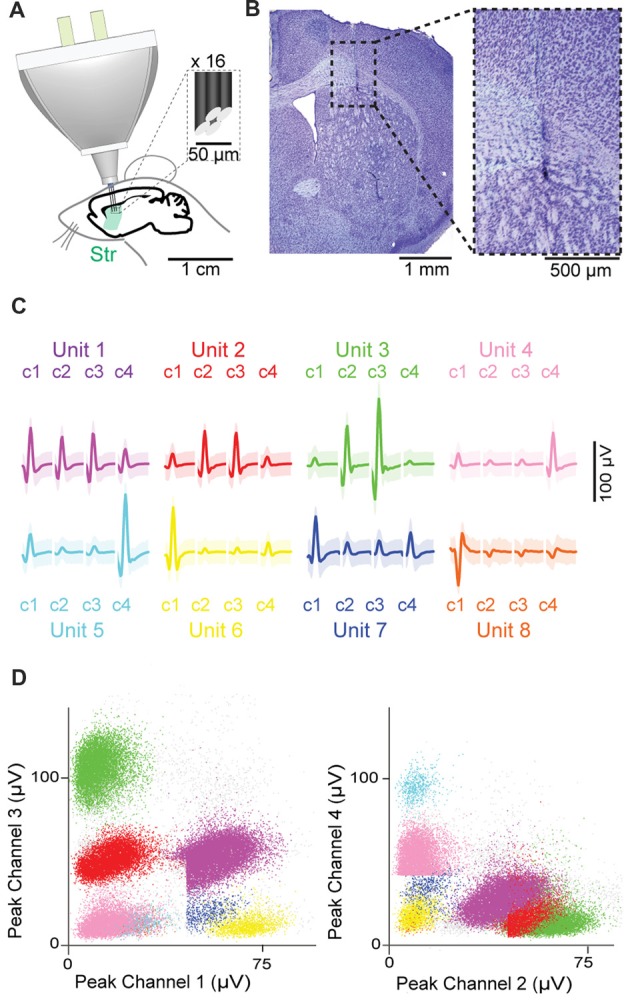
Figure 3.

Chronic recordings in the dorsal striatum. (A) Schematic representation of the recording preparation. Inset shows the tip of a tetrode at high magnification. (B) Histological images showing the position of the tetrode tip in the striatum. (C,D) Eight isolated single units recorded by four channels (c1–c4) of a single tetrode, with waveforms of each single unit (C) and scatter dot plots based on the magnitude of their peaks on each channel (D). Shading in (C) represents three standard deviations around the mean.
