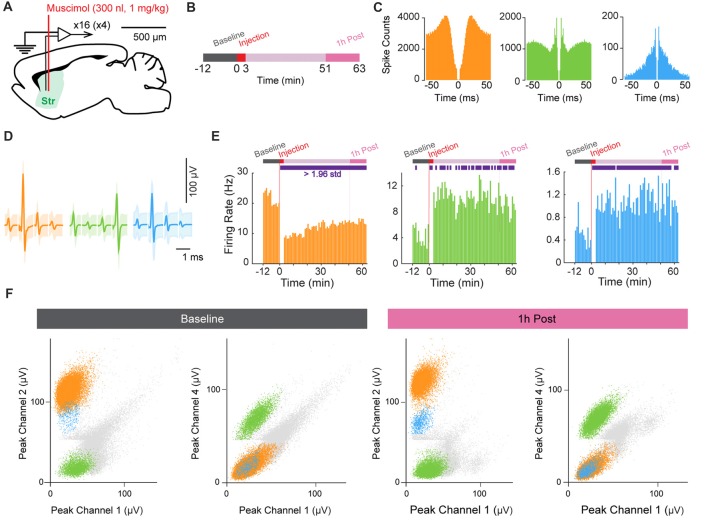
Figure 5.
Muscimol injection in the striatum. (A) Schematic representation of the recording and injection location in the striatum (Str). (B) Experimental design. (C,D) Autocorrelograms (C) and average spike waveforms (D) of isolated single units simultaneously recorded from one tetrode. Shading in (D) indicates three standard deviations around the mean. (E) Firing-rate histograms showing the time course of the changes in firing rate before and after muscimol injection (t = 0). Purple rectangles in the schematic experimental design (top) indicate the period when the signal was significantly different from the baseline period (>1.96 standard deviation away from the mean). (F) Scatter dot plots of single units simultaneously recorded during the baseline period before muscimol injection (left) and 1-h post-injection period (right). Spikes are plotted based on the peak amplitude of the waveforms recorded on the four channels of the same tetrode.

