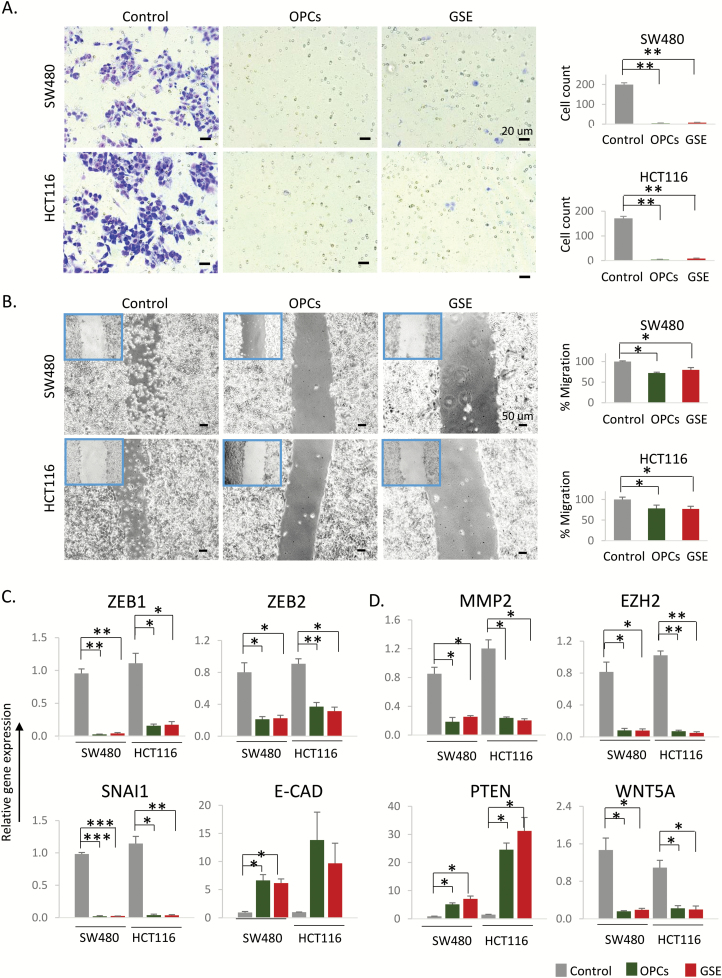
Figure 2.
OPCs and GSE inhibit cancer cell migration. (A) Left: Representative images of cells that migrated through the permeable membrane in a transwell migration plate, 6 h after treatment with OPCs or GSE at 100 ng/ul. Right: Count of cells that migrated through the membrane, shown as an average of triplicates. (B) Left: Representative images of monolayer of SW480 and HCT116 cells treated with 100 ng/ul OPCs or GSE, 6 h post scratch. Right: Quantification of migrated cells from triplicate treatments. (C) mRNA expression of EMT markers Zeb1, Zeb2, Snai1 and E-Cad in OPCs/GSE-treated HCT116 and SW480 cells, shown as fold change with respect to control cells treated with vehicle (DMSO). (D) mRNA expression of genes associated with cancer cell migration. *P < 0.05, **P < 0.01, ***P < 0.001 compared with control treatments.

