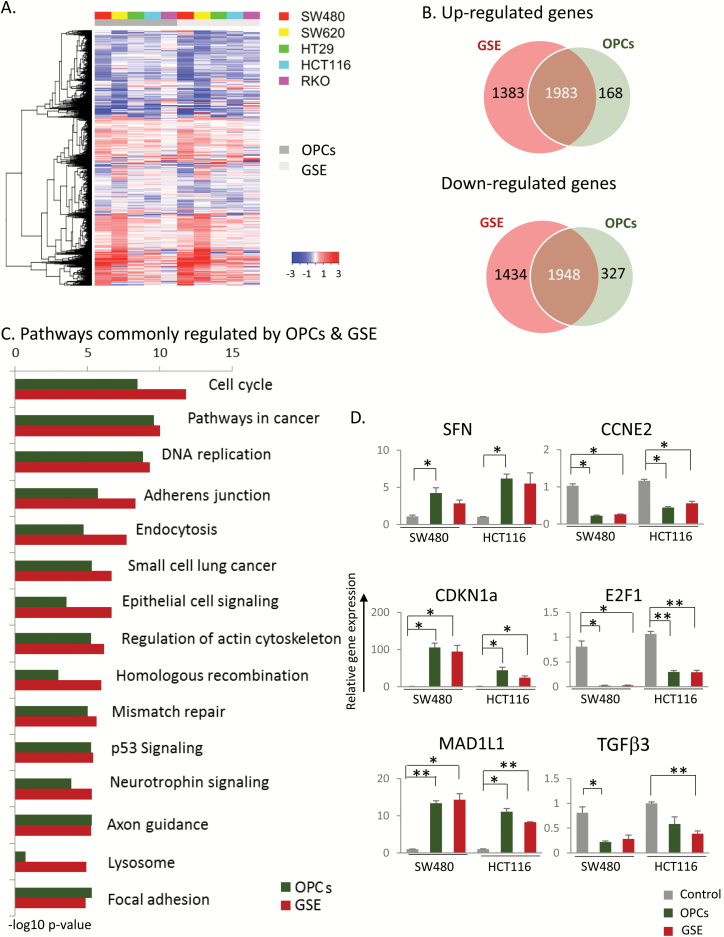
Figure 3.
OPCs and GSE inhibit multiple cancer-associated pathways. (A) Heatmap for five different cancer cell lines showing genes that were differentially expressed in cells treated with 100 ng/ul OPCs or GSE compared with control treated cells. (B) Venn diagram displaying the overlap between quantified mRNAs. (C) Ranking of pathways based on P-values that were identified by KEGG pathway analysis. (D) qPCR validation of top genes in cell cycle in SW480 and HCT116 cells, normalized to β-actin, shown as fold change with respect to control cells treated with vehicle (DMSO). *P < 0.05, **P < 0.01, ***P < 0.001 compared with control treatments.

