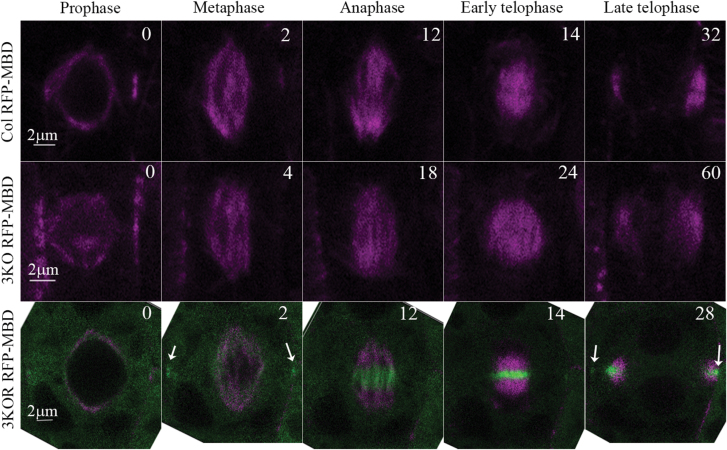
Fig. 7.
Time course of cell division in Columbia (Col), 3KO, and 3KOR plants. Live imaging of microtubules labeled by the RFP–MBD marker (magenta) and of the myosin XI-K:YFP in 3KOR plants (green) is shown. Numbers in the upper right corners indicate the time (min) from prophase (time 0). Relatively bright myosin XI-K:YFP fluorescence in the cell division zone (CDZ) observed at 2 min and 28 min is marked by white arrows in the bottom row.

