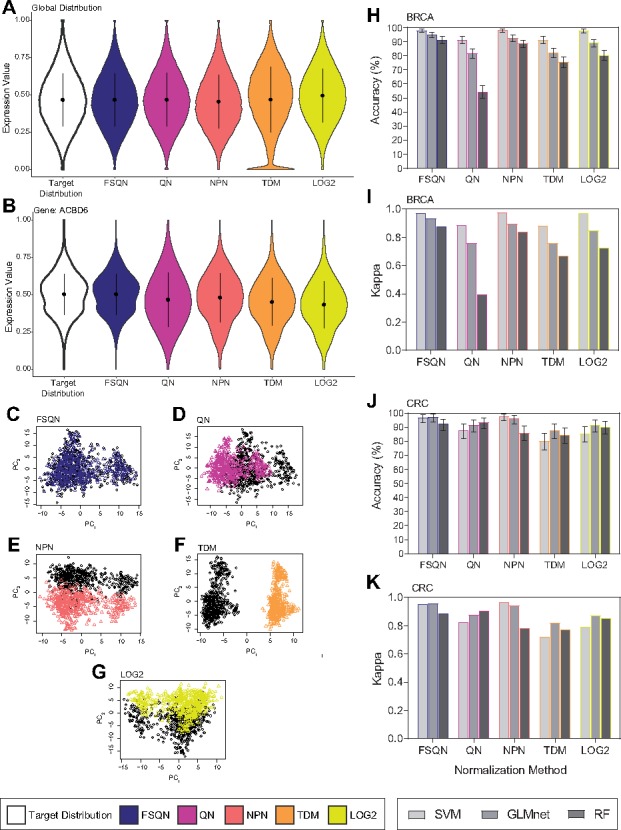
Fig. 4.

Normalization results with scaled data. Different normalization methods displayed from both a global (A) and a local perspective (B) of BRCA data. Principal components plot for FSQN (C), NPN (D), TDM (E) and LOG2 (G) normalized data and microarray data from BRCA datasets. Performance of classifications using normalized unscaled data classified by SVM, GLMnet and RF are reported as overall accuracy and kappa for the BRCA dataset (H, I) and the CRC dataset (J, K)
