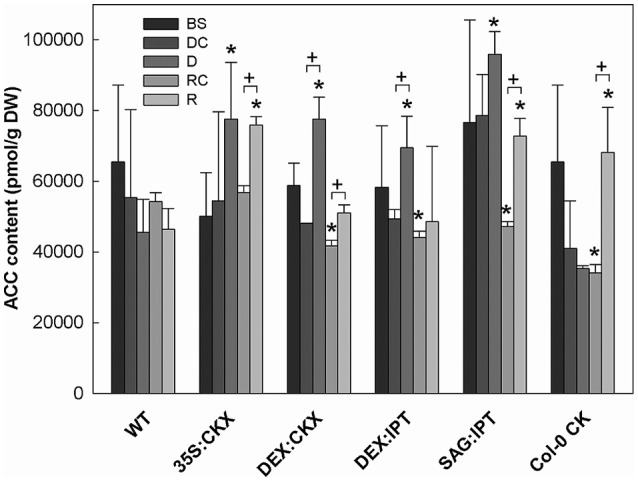
Figure 8.

The content of the ethylene precursor aminocyclopropane carboxylic acid (ACC). Specification of genotypes and treatments is as described in Figure 2. Data represent means ±SD (n = 6) in pmol per g DW. Statistically significant differences (p < 0.05, two-sample t-test) in ACC content between the corresponding variants of WT and transformants are marked (*), and between D/DC or R/RC variants within each genotype (+).
