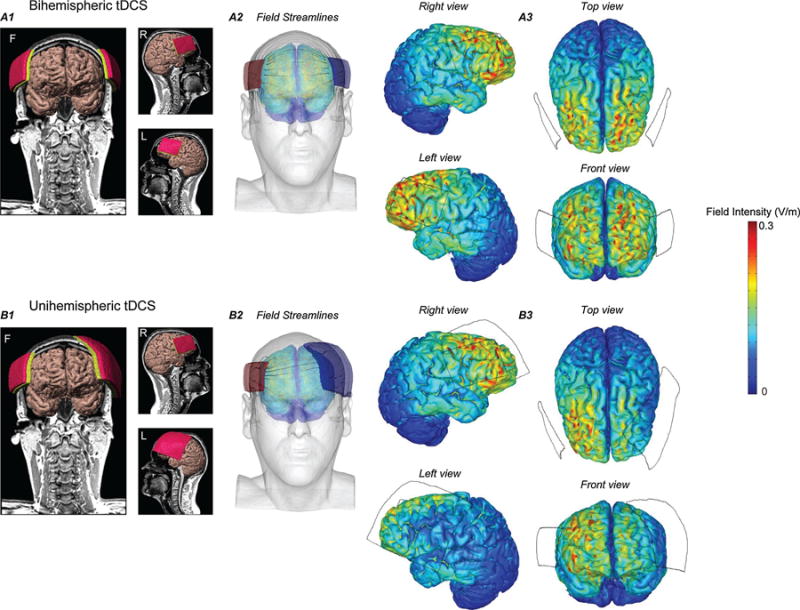
Fig. 5.

Computational finite element method(FEM) head models and a predicted field intensity of bi-hemisphere and uni-hemisphere tDCS montages. (A1, B1) 3D image of a segmented brain generated from an MRI scan of a healthy adult and different views (F, L, R) of electrode placement over the inferior frontal gyrus (IFG). (A2, B2) represent an orientation of magnitude controlled electric field streamlines inside the head tissue layers during tDCS. (A3, B3) Illustration of predicted field intensity and different views of brain under both stimulation conditions. Predicted results plotted at same color range (Peak = 0.3 V/m) indicated less field intensity under large electrode for unihemisphere tDCS, whereas for dual-hemisphere tDCS, field intensity was comparable under both anode and cathode.
