
Figure 1.
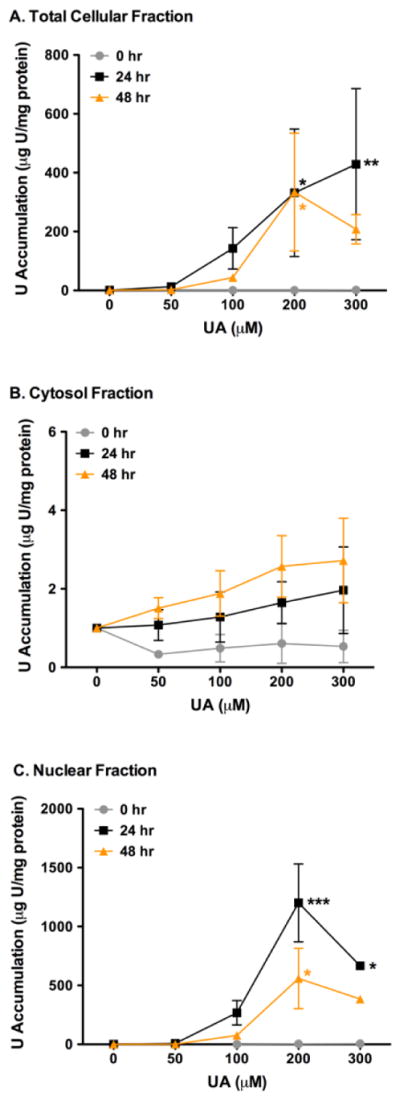
Time course of total intracellular U content (μg U/mg protein) in CHO AA8 cells after 0 (●), 24 (■), and 48 (▲) hr. A. U accumulation is seen after 24 hr in the whole total cellular fractions. B. No changes were seen in U in the cytosol after 0 – 48 hr exposure compared to the accumulation of U in the total cellular fractions and nuclear fractions. C. Increasing amounts of U is accumulated in the nuclear fraction after 24 hr. Cells were treated and UA concentrations were determined by ICP-MS and normalized for the total protein content as described in the text. P values were considered to be statistically significant as indicated with * (p < 0.05), ** (p < 0.01) and *** (p < 0.001) compared to untreated cells.