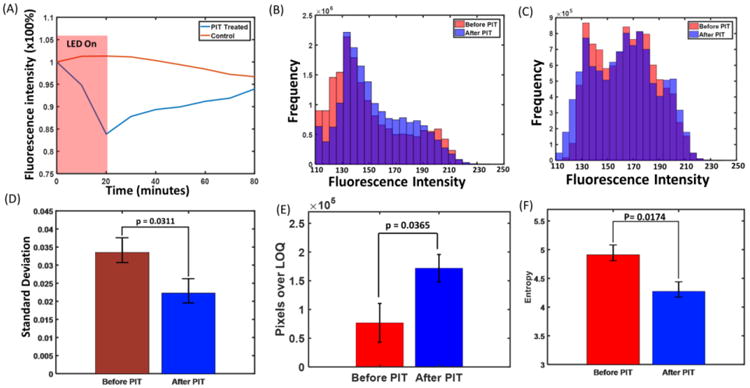
Fig. 2.

(A) Representative normalized average IR700 fluorescence intensity of the tumor during and after PIT treatment. (B) Histograms of the pixel intensity before and 60 min after PIT in the tumor. (C) Histograms of the pixel intensity at 0 min and 80 min in the control tumor (No PIT treatment). (D) Standard deviations (SDs) of the histograms of tumor before and 60 min after PIT treatment. Tumor before PIT shows a significant larger SD than that of tumor 60 min after PIT. (E) Pixels with values over the LOQ in the tumor before and 60 min after PIT treatment. Tumor 60 min after PIT has a significant larger pixel number with value over the background than that of tumor before PIT. (F) Entropy of pixels values in the tumor before and 60 min after PIT treatment. The pixels in the tumor 60 min after PIT have significant smaller entropy than that of tumor before PIT (n=5).
