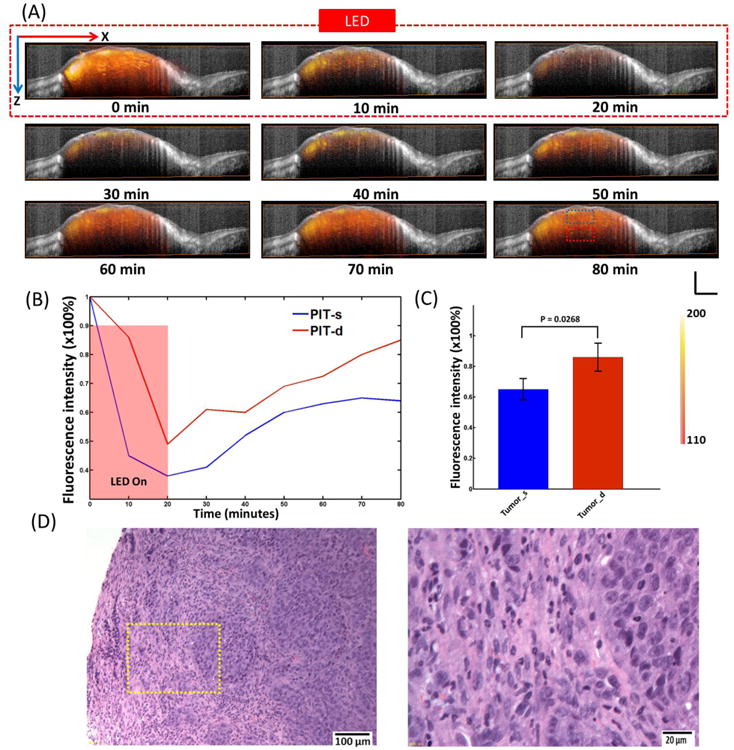
Fig. 3.

(A) Representative cross-sections from the 3D FLOT/OCT images of the mACs' micro-distribution in tumor at different time points during and after PIT Treatment. PIT treatment starts at 0 min and lasts for 20 min as indicated by the red dashed line. (B) Representative normalized average IR700 fluorescence intensity of tumor surface and deep tumor (as indicated by the dashed blue and red squares in Fig. 3A at 80 min) during and after PIT treatment. (C) IR700 fluorescence recovery value of the tumor surface and deep tumor. Deep tumors showed a significantly higher fluorescence recovery intensity value than that of the tumor surface (n=5). Scale bar 1 mm. (D) Histological specimens of A431 tumors from the PIT-treated group. There is more cell necrosis in tumor surface compared to deep tumor. The image on the right hand is the zoomed in image from the yellow square.
