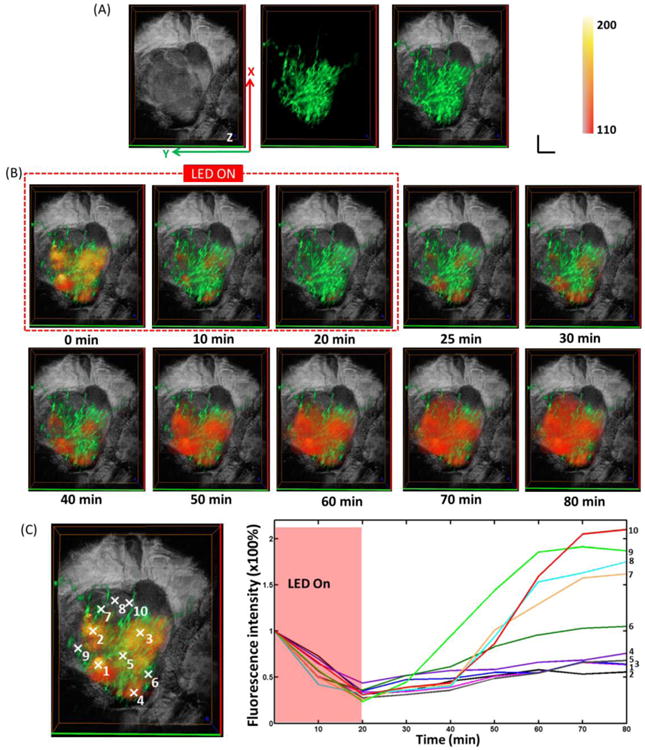
Fig. 4.

(A) Left: 3D OCT tumor image. Middle: FLOT images of blood vessel (green) on the tumor surface labelled by Oregon Green. Right: Fused OCT/FLOT image. (B) Representative 3D FLOT images of the micro-distribution of mACs in tumor at different time points during and after PIT Treatment (red-orange) superimposed with 3D tumor microstructure and corresponding 3D blood vessel on the tumor surface. PIT treatment starts at 0 min and lasts for 20 min as indicated by the red dashed line. Scale bar 1 mm. (C) Changes in fluorescence of the 3D tumor area during and after PIT treatment. Fluorescence signal was calculated from the positions (centered by the white marks in the left images: with 5 × 5 × 5 pixels size) numbered accordingly.
