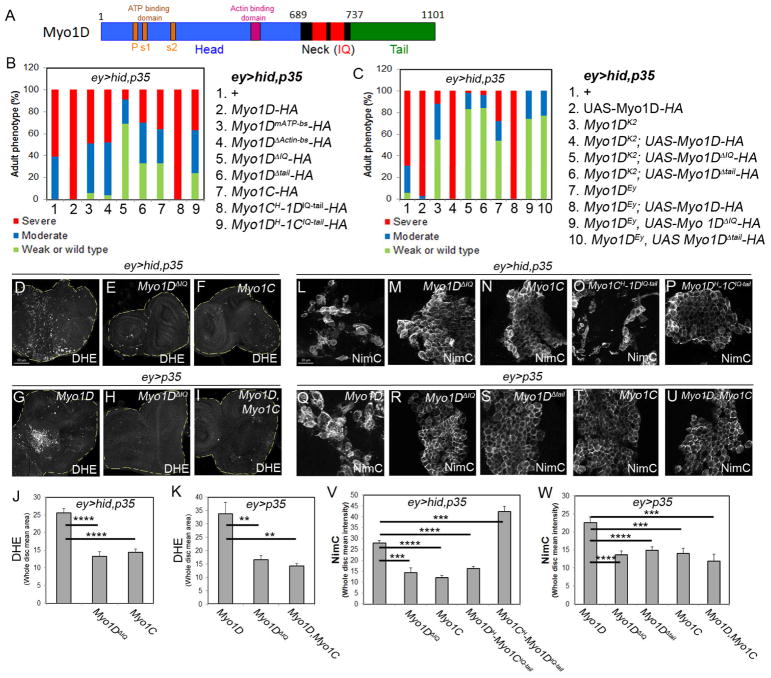
Figure 2. The neck (IQ) and tail regions of Myo1D are critical for AiP.
(A) Outline of the domain structure of Myo1D. P = P-loop; s1/2 = switch1/2-loop.
(B) Summary of the head phenotypes of ey>hid,p35 animals expressing the transgenes numbered and listed on the right. All Myo1D transgenes carry a HA-tag at the C-terminus.
(C) Summary of the rescue experiments of Myo1DK2 and Myo1DEY (Myo1DEy08859) mutants with wt and mutant Myo1D transgenes. The key to each genotype is numbered and listed on the right.
(D–I) DHE labeling as ROS marker of eye imaginal discs of indicated genotype. Myo1C suppresses Myo1D-induced ROS generation (I). Scale bar: 50μm.
(J,K) Quantification of the DHE labelings in (D–F) and (G–I). DHE signal intensity was determined across the entire discs.
(L–T) NimC labeling for visualization of hemocytes attached to eye imaginal discs of indicated genotype. Note that the activated hemocyte morphology in (L,O,Q) is absent in (M,N,P,R,S,T,U). Quantifications in (V) and (W). Scale bars: 20μm.
(V,W) Quantification of the NimC labelings in (L–P) and (Q–U) reveals that hemocytes recruitment to undead tissue requires the IQ (neck) and tail domains of Myo1D and can be antagonized by Myo1C. NimC signal intensity was determined across the entire discs.
See also Figure S4.

