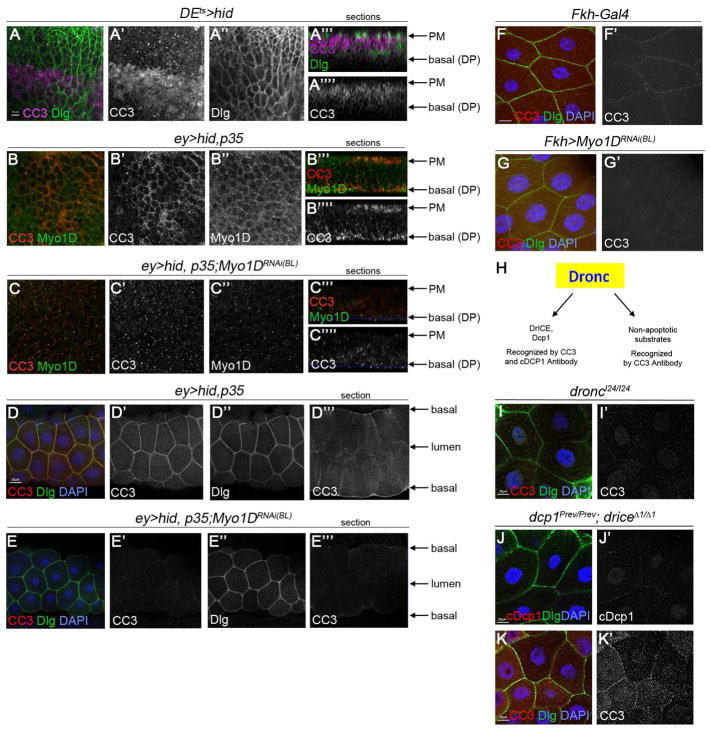
Figure 5. Non-apoptotic activity of Dronc at the plasma membrane.
(A–C‴′) Surface (A–A″,B–B″,C–C″) and section views (A‴,A‴′,B‴,B‴′,C‴,C‴′) according to Figure 4A of eye imaginal discs of indicated genotype labeled with cleaved caspase3 (CC3, red), the polarity marker Dlg (in A; green) and endogenous Myo1D (in B,C; green). Peripodial membrane (PM) and the basal side of the disc proper (DP) are indicated by arrows on the right of the sections. In (A), apoptosis was induced by shifting to 30°C for 12 hours prior to dissection (Fan et al., 2014). Scale bar: 10μm.
(D–E‴) Surface (D–D″;E–E″) and section views (D‴;E‴) of larval salivary glands (SG) according to Figure 4H of the indicated genotype labeled with CC3 and the polarity marker Dlg. In the sections, the basal sides of the plasma membrane and the lumen are indicated by arrows.
(F,G) Surface views of larval SGs of indicated genotype labeled for CC3 (green), the polarity marker Dlg (red) and DAPI (blue). Normal SGs have weak membrane localization of CC3 (F′) that is completely lost upon Myo1D RNAi driven by Fkh-Gal4 (G′). Scale bar: 20μm.
(H) Illustration of the specificities of CC3 and cDcp1 antibodies with respect to the apoptotic and non-apoptotic cleavage targets of Dronc.
(I,K′) droncI24/I24 (I) mutant and dcpPrev/Prev;drICE Δ1/Δ1 (J,K) double mutant SGs labeled for CC3 in (I,K), cleaved Dcp1 (cDcp1) in (J), the polarity marker Dlg and DAPI. Scale bars: 20μm.

