
Figure 4.
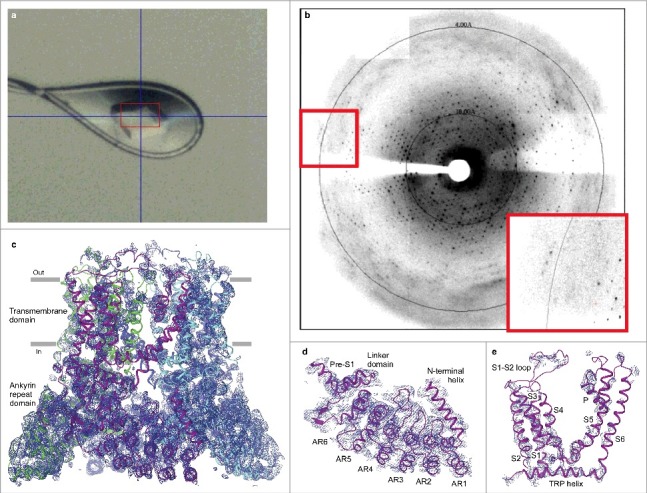
Crystallization of the RAD-NQ construct. (a) Example of an optimized RAD-NQ crystal flash frozen in a cryo-loop. The red box indicates boundaries of the X-ray beam. (b) 3.85 Å-resolution diffraction pattern for the RAD-NQ crystal. Inset is a magnified view of the diffraction pattern (red boxes). (c) Side view of the RAD-NQ tetramer that represents the content of the asymmetric unit. Each subunit is colored differently. Blue mesh represents the electron density map at 1.0 σ. (d–e) Close-up views of the electron density for the (d) ankyrin repeat and (e) transmembrane domains.