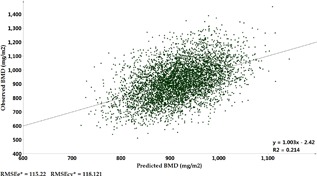
Figure 2.

Scatter plot of observed versus predicted total hip bone mineral density (BMD) values based on orthogonally filtered partial least square (O‐PLS) model with 280 metabolites among 4937 participants. *RMSEe = root mean square error of the estimation (the fit) for training sample; RMSEcv = root mean square error for cross‐validation sample.
