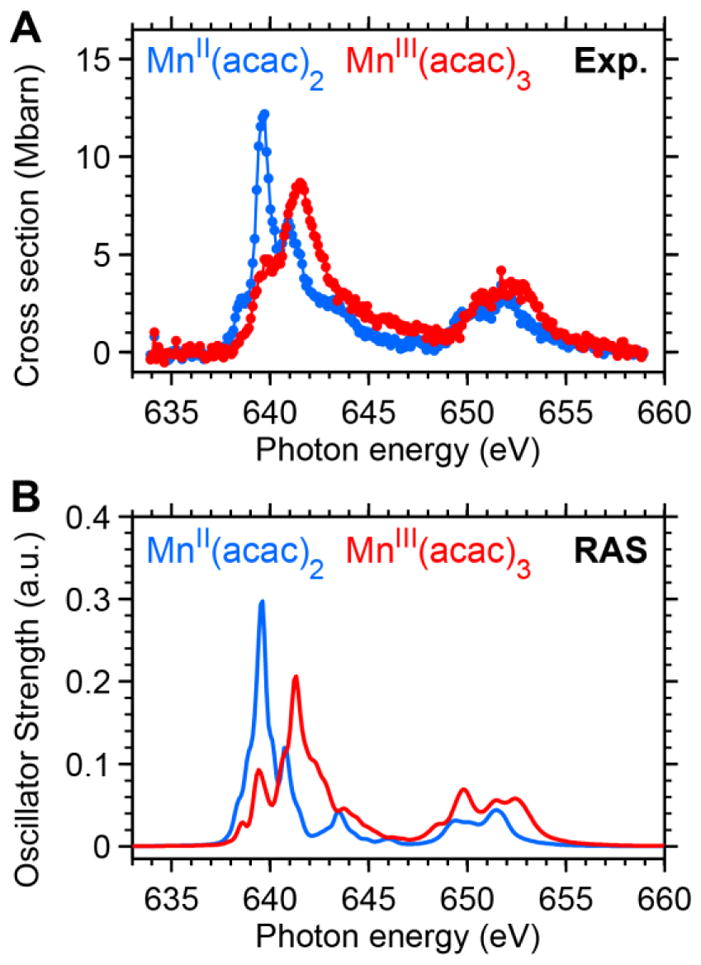
Figure 3.

Comparison of absolute L-edge XAS absorption cross sections of MnII(acac)2 and MnIII(acac)3 in solution from (A) experiment and (B) ab-initio restricted active space (RAS) theory. The experimental spectra are averaged over several single-scan spectra and were calibrated in analogy to the PFY-XAS spectra in ref. 13. Both RAS spectra were calibrated using the same energy shift for coinciding L3-edge peak positions in the RAS and the experimental spectra of MnII(acac)2. The absorption amplitudes of experimental and RAS spectra are quantified in Table S2 in the Supporting Information.
