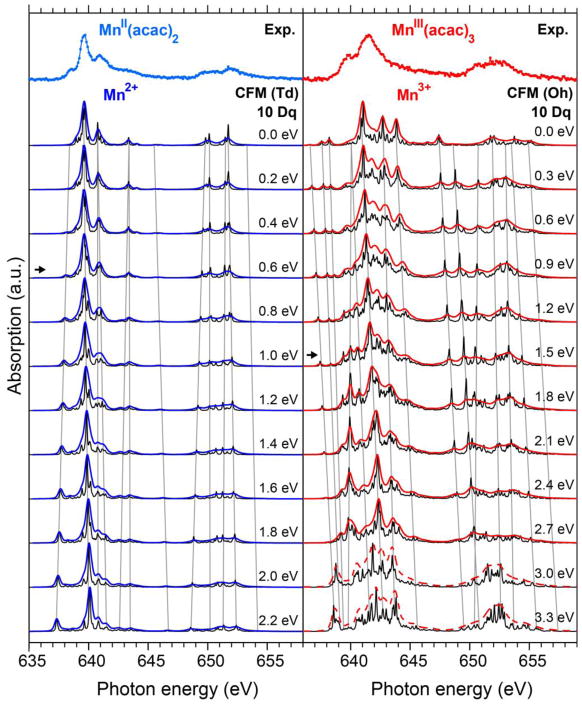
Figure 5.
Comparison of experimental L-edge XAS spectra of MnII(acac)2 (top left) and MnIII(acac)3 (top right) to crystal field multiplet (CFM) calculations (rows 2 to 13) with a variable ligand field splitting (LFS) for Mn2+ (left) in Td symmetry and Mn3+ (right) in Oh symmetry. The red and blue spectrum curves in rows 2–13 were calculated with the broadenings similar to the experimental values (see methods section). The black curves are broadened with a Lorentzian width 0.1 eV (FWHM) and a Gaussian width σ=0.01 eV for better discrimination of the underlying multiplet features. The experimental spectra are best reproduced by the CFM spectra marked with arrows. All CFM spectra of Mn2+ and Mn3+ have been shifted by the same constant offsets of −0.7 eV and −0.5 eV, respectively.

