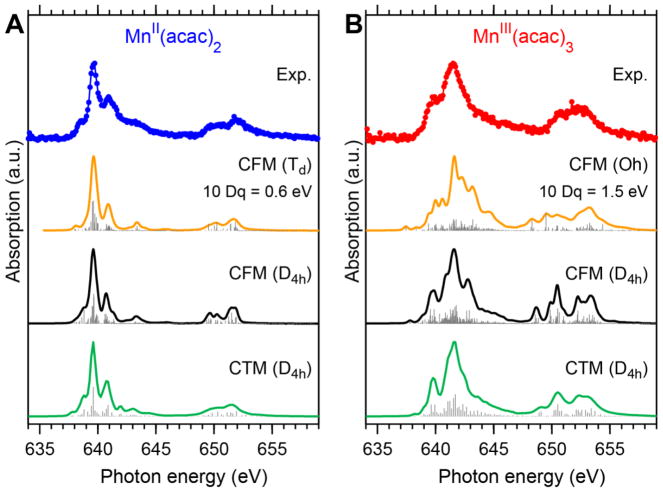
Figure 6.
Comparison of experimental spectra of MnII(acac)2 (A) and MnIII(acac)3 (B) in solution to the best fitting CFM(Td/Oh) spectra (orange) (arrows in Fig. 5) and those fitted with CFM(D4h) (black) and CTM(D4h) (green). The sticks denote the transitions to individual XAS final states underlying to the calculated spectra. The energy axis of all CFM and CTM spectra was aligned to that of the experimental spectra for coinciding L3-edge peak-maximum positions. All fit parameters are given in Table S1 in the Supporting Information.

