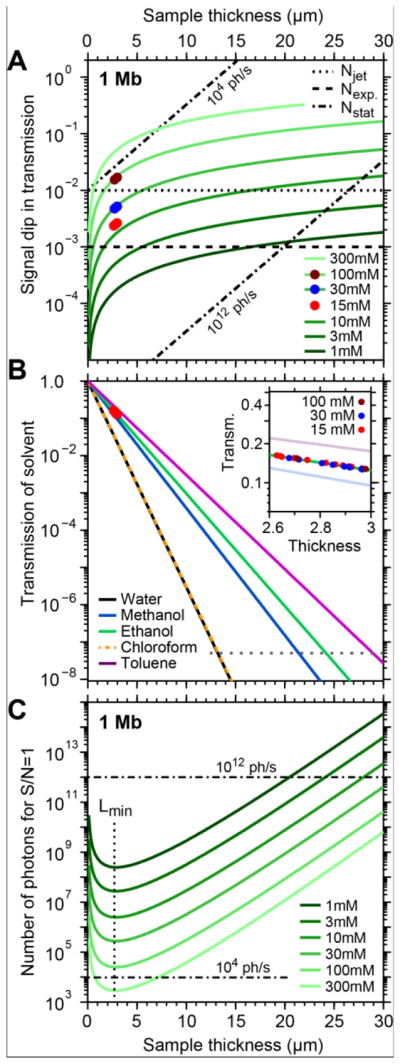
Figure 8.

Comparison of signal and noise amplitudes for L-edge XAS of dilute Mn complexes under our experimental conditions and in the theoretical limit. (A) Expected vs. experimental signal dips in transmission for a 1 Mb absorption feature at the Mn L-edge. The expected curves were derived for 640 eV photon energy and the solvent ethanol, using Henke’s tables. The dashed/dotted lines assign the experimental and theoretical detection limits (see main text) for an acquisition time of 1 s per spectrum data point. (B) Transmission of typical solvents at the Mn L-edge (640 eV) with a magnification of the experimental range (inset). (C) Theoretical minimum number of incoming photons for detecting a 1 Mb absorption feature with S/N=1, here for statistical shot noise, using the solvent ethanol.
