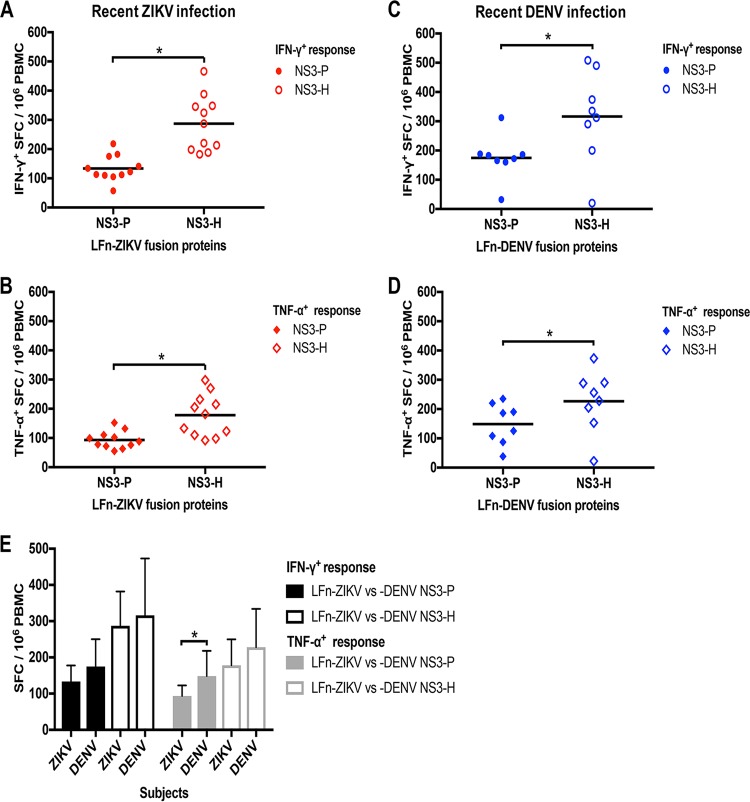
FIG 3.
Ex vivo T cell reactivity to ZIKV or DENV LFn fusion proteins in the recent phase of ZIKV or DENV infection. PBMC samples from ZIKV IgM-positive subjects collected during the recent phase of infection were subjected to homologous LFn NS3 protease and helicase protein stimulation in IFN-γ (A) and TNF-α (B) LFn ELISPOT ex vivo experiments. LFn-ZIKV-NS3-P IFN-γ, red-shaded circle; LFn-ZIKV-NS3-H IFN-γ, red-outlined circle; LFn-ZIKV-NS3-P TNF-α, red-shaded diamond; LFn-ZIKV-NS3-H TNF-α, red-outlined diamond. PBMC samples from DENV IgM-positive subjects collected during the recent phase of infection were subjected to homologous LFn NS3 protease and helicase protein stimulation in IFN-γ (C) and TNF-α (D) LFn ELISPOT ex vivo experiments. LFn-DENV-NS3-P IFN-γ, blue-shaded circle; LFn-DENV-NS3-H IFN-γ, blue-outlined circle; LFn-DENV-NS3-P TNF-α, blue-shaded diamond; LFn-DENV-NS3-H TNF-α, blue-outlined diamond. Responses are expressed as the number of secreting cells per 106 PBMCs and are considered positive if the net numbers of spot-forming cells (SFC) per 106 are ≥55, are greater than four times the mean background, and are three standard deviations above the background. (E) Comparison of IFN-γ ZIKV versus DENV NS3 protease (black-shaded bars) and helicase (black-outlined bars) and TNF-α ZIKV versus DENV NS3 protease (gray-shaded bars) and helicase (gray-outlined bars) T cell responses in ZIKV and DENV subjects. Magnitude of responses is expressed as geometric positive mean, and statistical analysis was performed with Mann-Whitney U test. *, P < 0.05.

