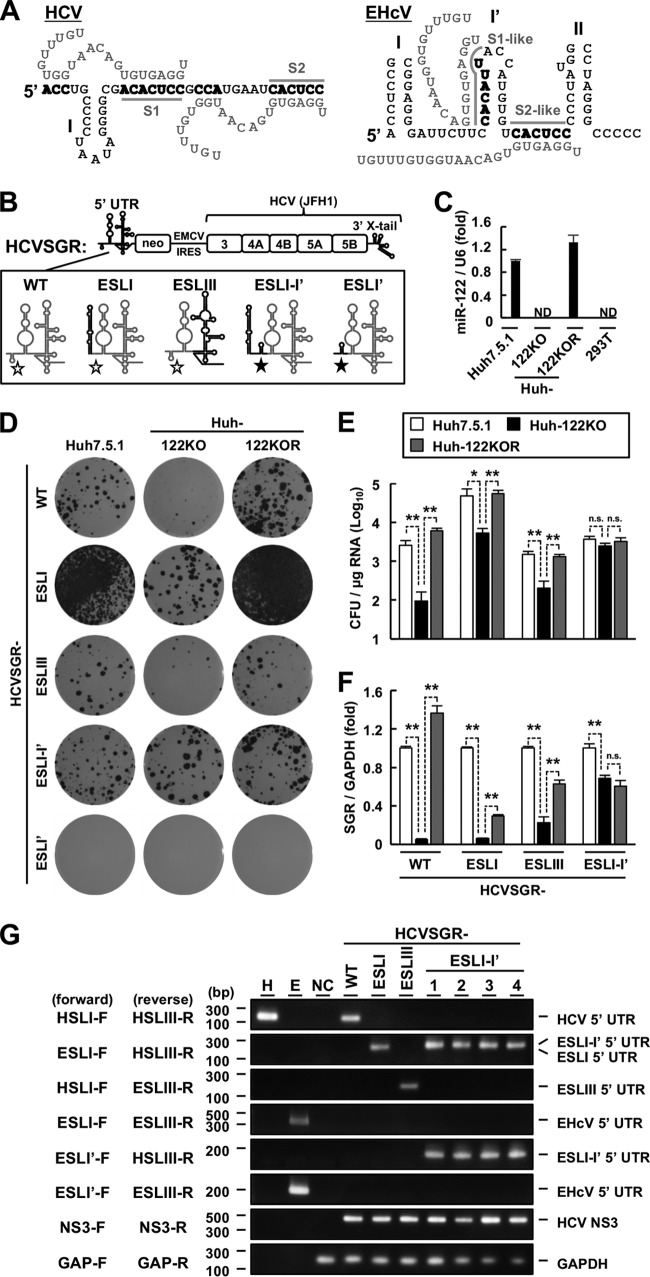
FIG 6.
Role of miR-122 in viral replication. (A) (Left) Schematic diagram of the interaction between the HCV 5′ UTR (black letters) and two miR-122 molecules (gray letters). The gray lines indicate the S1 and S2 regions. (Right) Schematic diagram of a putative model for the interaction between the EHcV 5′ UTR (black letters) and two miR-122 molecules (gray letters). The gray lines indicate S1- and S2-like regions. The 5′ UTR nucleotides binding to miR-122 are in boldface. (B) Schematic diagram of the WT HCV subgenomic replicon (HCVSGR-WT) and mutants. The region spanning from the 5′ terminus to the S2 site of HCVSGR-WT was replaced with the region spanning from domains I to I′ of the EHcV 5′ UTR (HCVSGR-ESLI-I′) or with domain I′ of the EHcV 5′ UTR (HCVSGR-ESLI′). The domain structures of HCV and EHcV are illustrated with gray and black lines, respectively. The open stars indicate the S1 and S2 sites of HCV, while the filled stars indicate the S1- and S2-like sites of the EHcV 5′ UTR. (C) Total RNAs were extracted from Huh7.5.1, Huh-122KO, Huh-122KOR, and 293T cells. miR-122 levels were quantified by qRT-PCR and standardized to U6 small nuclear RNA levels. ND, not detected. (D) HCVSGR-WT and each mutant were electroporated into the indicated cell lines. The resulting cells were subjected to colony formation assays. (E) Colony counts were estimated using ImageJ software to calculate the CFU. (F) HCVSGR-WT and the mutant RNAs were electroporated into the indicated cell lines. The resulting cells were harvested at 48 h posttransfection. Total RNAs were extracted from the cells and subjected to qRT-PCR. The amount of intracellular HCVSGR RNA was estimated and normalized to the amount of GAPDH mRNA. (G) Total RNA extracted from the cells was subjected to RT-PCR analysis using the indicated primer pairs (Table 1). Clone numbers are indicated at the top. In vitro-transcribed RNAs including the HCV 5′ UTR (lane H) or EHcV 5′ UTR (lane E) were used as positive controls. The total RNA extracted from the nontransfected cells (NC) was used as a negative control. The data are representative of the results of three independent experiments. *, P < 0.05; **, P < 0.01; n.s., not significant. The error bars indicate standard deviations.

