FIG 7.
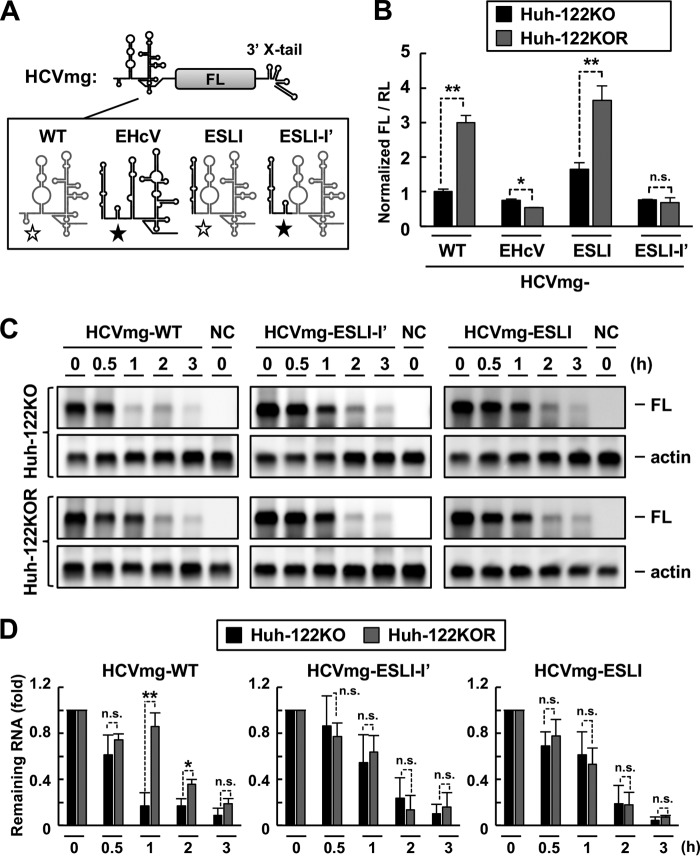
Effects of miR-122 on IRES activity and RNA stability. (A) Schematic diagram of HCVmg RNA carrying the HCV (WT), EHcV, ESLI, or ESLI-I′ 5′ UTR. The domain structures of HCV and EHcV are illustrated with gray and black lines, respectively. The open stars indicate the S1 and S2 sites of HCV, while the filled stars indicate the S1- and S2-like sites of the EHcV 5′ UTR. (B) HCVmg RNA or each mutant was transfected into Huh-122KO or Huh-122KOR cells with the capped and polyadenylated RNA including the RL ORF. The resulting cells were harvested at 6 h posttransfection and subjected to a dual-luciferase assay or total RNA extraction. The amount of intracellular HCVmg RNA was estimated by qRT-PCR. The ratio of FL to RL was normalized to the amount of HCVmg RNA (WT). (C) Each HCVmg RNA was transfected into Huh-122KO or Huh-122KOR cells. The transfected cells were harvested at the indicated time points and then subjected to Northern blotting. The data are representative of the results of three independent experiments. (D) Quantification of HCVmg RNAs from Northern blotting (C) by densitometric analysis. The intensities of the bands of HCVmg RNA and actin mRNA were quantified from three separate experiments with ImageJ software. Each intensity of HCVmg RNA was normalized with that of actin mRNA. The relative amount of remaining HCVmg RNA is indicated as the mean and SD. *, P < 0.05; **, P < 0.01; n.s., not significant.

