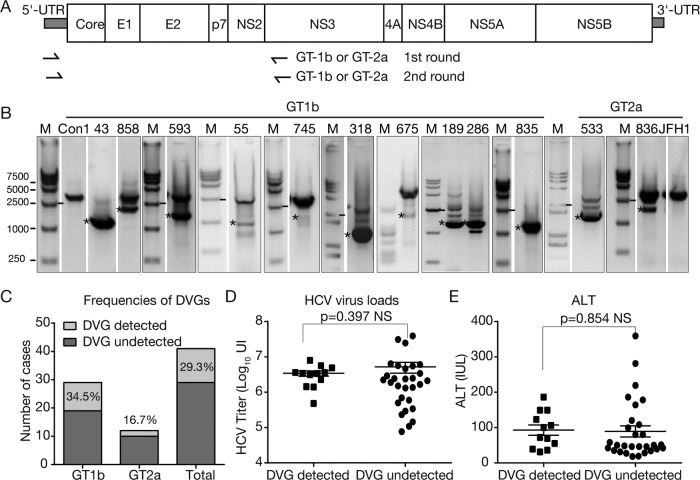
FIG 1.
Identification of HCV DVGs from clinical isolates. (A) Schematic of the HCV genome and positions of primers used to detect DVGs in this study. (B) Agarose gel electrophoresis of PCR products to amplify DVGs. HCV prototype strains con1 (GT-1b) and JFH1 (GT-2a) were included as controls. The PCR products potentially derived from DVGs are labeled with asterisks. The gel graph was modified so that only the lanes with shorter PCR products are shown. The original gel graph is available upon request. M, molecular weight marker. (C) Frequencies of DVGs in 41 clinical isolates. (D) Correlation of DVGs with viral loads. (E) Correlation of DVGs with ALT levels. NS, nonsignificant.

