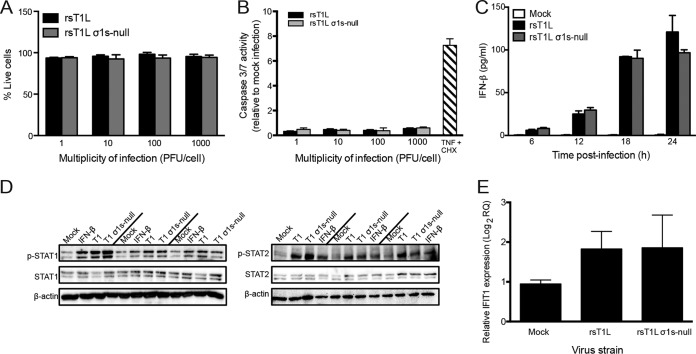
FIG 3.
The σ1s protein does not modulate cell death or type I interferon responses in SVECs. (A and B) SVECs were either mock infected or infected with rsT1L or rsT1L σ1s-null at an MOI of 1, 10, 100, or 1,000 PFU/cell. (A) At 24 h, cell viability was determined by trypan blue staining. Results are presented as mean viabilities from three independent experiments. Error bars indicate standard deviations. (B) At 24 h, caspase-3/7 activity was measured by a caspase-3/7 Glo assay. TNF-α and cycloheximide (CHX) were included as a positive control for caspase-3/7 activation. Results are presented as mean luminescence values from three independent experiments. (C through E) SVECs were infected with rsT1L or rsT1L σ1s-null at an MOI of 100 PFU/cell. (C) IFN-β levels in the supernatants were measured by ELISA at 24 h. Results are presented as mean IFN-β concentrations from three independent experiments. (D) At 6, 12, and 18 h, whole-cell lysates were prepared, and proteins were separated by SDS-PAGE. Immunoblot analysis was performed for phosphorylated STAT1 (p-STAT1), total STAT1, and β-actin (left panels) or p-STAT2, total STAT2, and β-actin (right panels). (E) At 24 h, IFIT1 mRNA levels were quantified by RT-qPCR. Results are presented as IFIT1 expression relative to that at 0 h postinfection.

