
FIG 4.
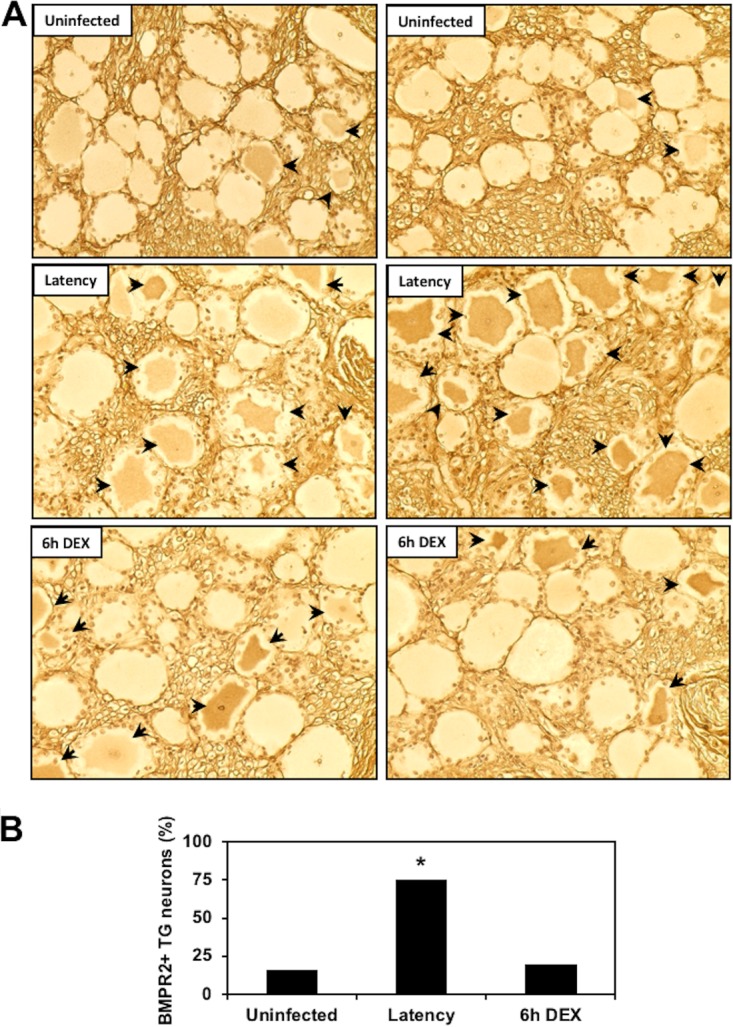
Comparison of BMPR2 expression during the BoHV-1 latency-reactivation cycle. (A) TG were collected from 3 uninfected calves, 3 latently infected calves, or 3 latently infected calves treated with DEX for 6 h to initiate reactivation from latency. IHC was performed as described in Materials and Methods using a BMPR2 monoclonal antibody (MA5-15827; ThermoFisher Scientific); arrows denote BMPR2+ TG neurons. Magnification is approximately ×400, and these sections are representative of many sections that were examined. (B) Quantification of BMPR2+ TG neurons. The percentage of BMPR2+ TG neurons from uninfected calves (429 neurons were counted), latently infected calves (435 neurons), or latently infected calves treated with DEX for 6 h to initiate reactivation (417 neurons) were calculated. The asterisk denotes significant differences (P < 0.05) in the numbers of BMPR2+ TG neurons as determined by a Student t test.