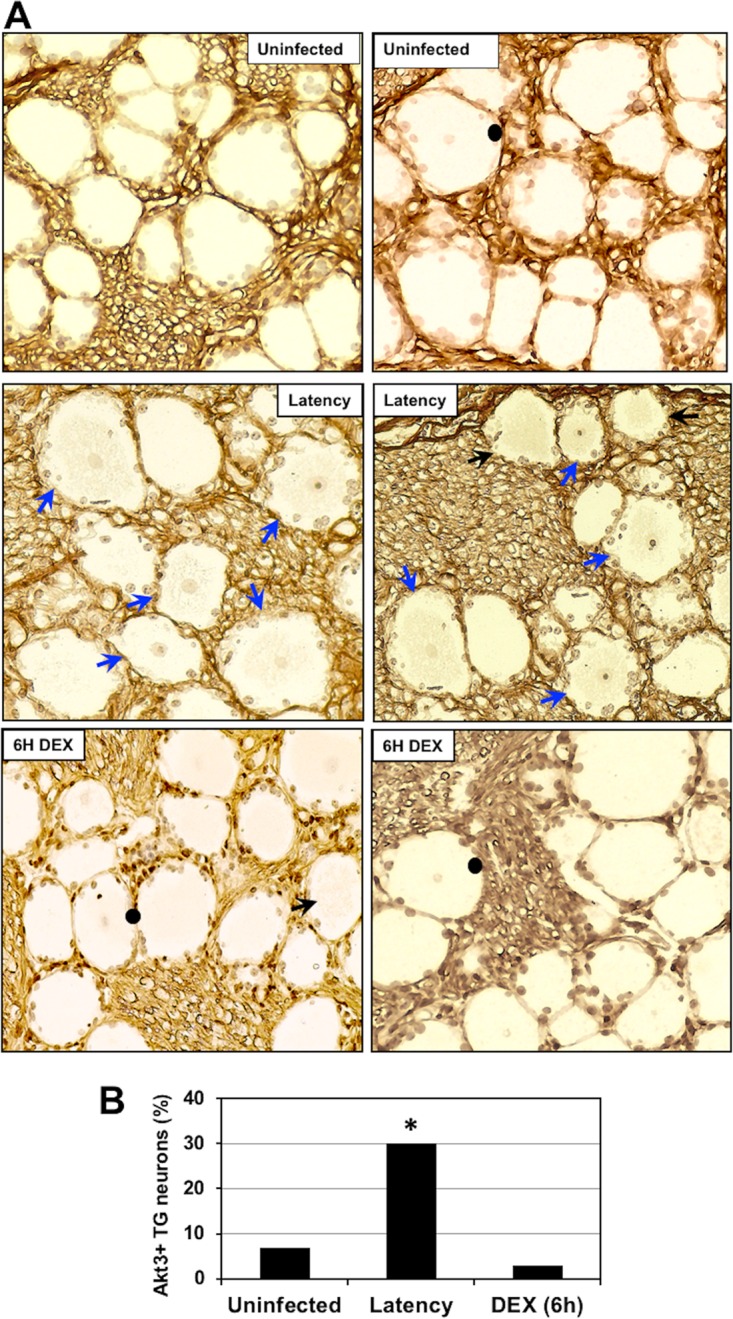
FIG 6.

Comparison of Akt3 expression during the BoHV-1 latency-reactivation cycle. (A) TG were collected from 3 uninfected calves, 3 latently infected calves, or 3 latently infected calves treated with DEX for 6 h to initiate reactivation from latency. Thin sections were cut from formalin-fixed paraffin-embedded TG sections. The Akt3 antibody (ab152157; Abcam) was diluted 1:500. Biotinylated goat anti-rabbit IgG (Vector Laboratories) was used as a secondary antibody. Blue arrows denote Akt3-positive TG neurons that contained an Akt3-positive nucleus and a counterstained nucleolus. Black arrows denote TG neurons in which the nucleus was not visible, but they were Akt3+. Closed circles denote TG neurons that contain a nucleus in which the nucleolus is counterstained but was not stained by the Akt3 antibody. These images are representative of many sections stained with the Akt3 antibody. Magnification is approximately 400×. (B) The percentage of Akt3-positive TG neurons from 500 total neurons was estimated from sections derived from 3 latently infected calves, 3 mock-infected calves, and 3 latently infected calves treated with DEX for 6 h. An asterisk denotes significant differences (P < 0.05) in the number of Akt3-positive neurons as determined by a Student t test.
